Veeam & Proxmox VE
Veeam has made a strategic move by integrating the open-source virtualization solution Proxmox VE (Virtual Environment) into its portfolio. Signaling its commitment into the evolving needs of the open-source community and the open-source virtualization market, this integration positions Veeam as a forward-thinking player in the industry, ready to support the rising tide of open-source solutions. The combination of Veeam’s data protection solutions with the flexibility of Proxmox VE’s platform offers enterprises a compelling alternative that promises cost savings and enhanced data security.
With the Proxmox VE, now also one of the most important and often requested open-source solution and hypervisor is being natively supported – and it could definitely make a turn in the virtualization market!
Opportunities for Open-Source Virtualization
In many enterprises, a major hypervisor platform is already in place, accompanied by a robust backup solution – often Veeam. However, until recently, Veeam lacked direct support for Proxmox VE, leaving a gap for those who have embraced or are considering this open-source virtualization platform. The latest version of Veeam changes the game by introducing the capability to create and manage backups and restores directly within Proxmox VE environments, without the need for agents inside the VMs.
This advancement means that entire VMs can now be backed up and restored across any hypervisor, providing unparalleled flexibility. Moreover, enterprises can seamlessly integrate a new Proxmox VE-based cluster into their existing Veeam setup, managing everything from a single, central point. This integration simplifies operations, reduces complexity, and enhances the overall efficiency of data protection strategies in environments that include multiple hypervisors by simply having a one-fits-all solution in place.
Also, an heavily underestimated benefit, offers the possibilities to easily migrate, copy, backup and restore entire VMs even independent of their underlying hypervisor – also known as cross platform recovery. As a result, operators are now able to shift VMs from VMware ESXi nodes / vSphere, or Hyper-V to Proxmox VE nodes. This provides a great solution to introduce and evaluate a new virtualization platform without taking any risks. For organizations looking to unify their virtualization and backup infrastructure, this update offers a significant leap forward.
Integration into Veeam
Integrating a new Proxmox cluster into an existing Veeam setup is a testament to the simplicity and user-centric design of both systems. Those familiar with Veeam will find the process to be intuitive and minimally disruptive, allowing for a seamless extension of their virtualization environment. This ease of integration means that your new Proxmox VE cluster can be swiftly brought under the protective umbrella of Veeam’s robust backup and replication services.
Despite the general ease of the process, it’s important to recognize that unique configurations and specific environments may present their own set of challenges. These corner cases, while not common, are worth noting as they can require special attention to ensure a smooth integration. Rest assured, however, that these are merely nuances in an otherwise straightforward procedure, and with a little extra care, even these can be managed effectively.
Overview
Starting with version 12.2, the Proxmox VE support is enabled and integrated by a plugin which gets installed on the Veeam Backup server. Veeam Backup for Proxmox incorporates a distributed architecture that necessitates the deployment of worker nodes. These nodes function analogously to data movers, facilitating the transfer of virtual machine payloads from the Proxmox VE hosts to the designated Backup Repository. The workers operate on a Linux platform and are seamlessly instantiated via the Veeam Backup Server console. Their role is critical and akin to that of proxy components in analogous systems such as AHV or VMware backup solutions.
Such a worker is needed at least once in a cluster. For improved performance, one worker for each Proxmox VE node might be considered. Each worker requires 6 vCPU, 6 GB memory and 100 GB disk space which should be kept in mind.
Requirements
This blog post assumes that an already present installation of Veeam Backup & Replication in version 12.2 or later is already in place and fully configured for another environment such like VMware. It also assumes that the Proxmox VE cluster is already present and a credential with the needed roles to perform the backup/restore actions is given.
Configuration
The integration and configuration of a Proxmox VE cluster can be fully done within the Veeam Backup & Replication Console application and does not require any additional commands on any cli to be executed. The previously mentioned worker nodes can be installed fully automated.
Adding a Proxmox Server
 To integrate a new Proxmox Server into the Veeam Backup & Replication environment, one must initiate the process by accessing the Veeam console. Subsequently, navigate through the designated sections to complete the addition:
Virtual Infrastructure -> Add Server
This procedure is consistent with the established protocol for incorporating nodes from other virtualization platforms that are compatible with Veeam.
Afterwards, Veeam shows you a selection of possible and supported Hypervisors:
- VM vSphere
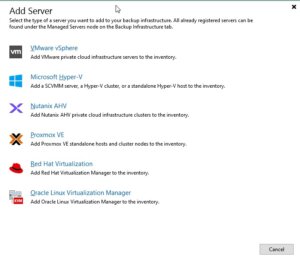
- Microsoft Hyper-V
- Nutanix AHV
- RedHat Virtualization
- Oracle Virtualization Manager
- Proxmox VE
In this case we simply choose Proxmox VE and proceed the setup wizard.
During the next steps in the setup wizard, the authentication details, the hostname or IP address of the target Proxmox VE server and also a snapshot storage of the Proxmox VE server must be defined.
Hint: When it comes to the authentication details, take care to use functional credentials for the SSH service on the Proxmox VE server. If you usually use the root@pam credentials for the web interface, you simply need to prompt root to Veeam. Veeam will initiate a connection to the system over the ssh protocol.
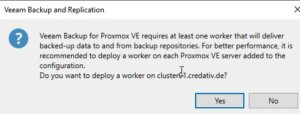 In one of the last surveys of the setup wizard, Veeam offers to automatically install the required worker node. Such a worker node is a small sized VM that is running inside the cluster on the targeted Proxmox VE server. In general, a single worker node for a cluster in enough but to enhance the overall performance, one worker for each node is recommended.
Usage
 Once the Proxmox VE server has been successfully integrated into the Veeam inventory, it can be managed as effortlessly as any other supported hypervisor, such as VMware vSphere or Microsoft Hyper-V. A significant advantage, as shown in the screenshot, is the capability to centrally administrate various hypervisors and servers in clusters. This eliminates the necessity for a separate Veeam instance for each cluster, streamlining operations. Nonetheless, there may be specific scenarios where individual setups for each cluster are preferable.
As a result, this does not only simplify the operator’s work when working with different servers and clusters but also provides finally the opportunity for cross-hypervisor-recoveries.
Creating Backup Jobs
Creating a new backup job for a single VM or even multiple VMs in a Proxmox environment is as simple and exactly the same way, like you already know for other hypervisors. However, let us have a quick summary about the needed tasks:
Open the Veeam Backup & Replication console on your backup server or management workstation. To start creating a backup job, navigate to the Home tab and click on Backup Job, then select Virtual machine from the drop-down menu.
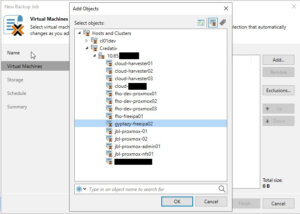
When the New Backup Job wizard opens, you will need to enter a name and a description for the backup job. Click Next to proceed to the next step. Now, you will need to select the VMs that you want to back up. Click Add in the Virtual Machines step and choose the individual VMs or containers like folders, clusters, or entire hosts that you want to include in the backup. Once you have made your selection, click Next.
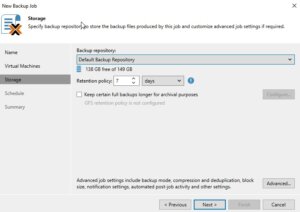 The next step is to specify where you want to store the backup files. In the Storage step, select the backup repository and decide on the retention policy that dictates how long you want to keep the backup data. After setting this up, click Next.
If you have configured multiple backup proxies, the next step allows you to specify which one to use. If you are not sure or if you prefer, you can let Veeam Backup & Replication automatically select the best proxy for the job. Click Next after making your choice.
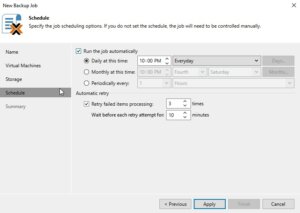 Now it is time to schedule when the backup job should run. In the Schedule step, you can set up the job to run automatically at specific times or in response to certain events. After configuring the schedule, click Next.
Review all the settings on the summary page to ensure they are correct. If everything looks good, click Finish to create the backup job.

If you want to run the backup job immediately for ensuring everything works as expected, you can do so by right-clicking on the job and selecting Start. Alternatively, you can wait for the scheduled time to trigger the job automatically.
Restoring an entire VM
The restore and replication process for a full VM restore remains to the standard procedures. However, it now includes the significant feature of cross-hypervisor restore. This functionality allows for the migration of VMs between different hypervisor types without compatibility issues. For example, when introducing Proxmox VE into a corporate setting, operators can effortlessly migrate VMs from an existing hypervisor to the Proxmox VE cluster. Should any issues arise during the testing phase, the process also supports the reverse migration back to the original hypervisor. Let us have a look at the details.
Open the Veeam Backup & Replication console on your backup server or management workstation. To start creating a backup job, navigate to the Home tab and click on Backup Job, then select Virtual machine from the Disk menu.
Choose the Entire VM restore option, which will launch the wizard for restoring a full virtual machine. The first step in the wizard will ask you to select a backup from which you want to restore. You will see a list of available backups; select the one that contains the VM you wish to restore and proceed to the next step by clicking Next.
Now, you must decide on the restore point. Typically, this will be the most recent backup, but you may choose an earlier point if necessary. After selecting the restore point, continue to the next step.
 The wizard will then prompt you to specify the destination for the VM. This is the very handy point for cross-hypervisor-restore where this could be the original location or a new location if you are performing a migration or don’t want to overwrite the existing VM. Configure the network settings as required, ensuring that the restored VM will have the appropriate network access.
In the next step, you will have options regarding the power state of the VM after the restoration. You can choose to power on the VM automatically or leave it turned off, depending on your needs.
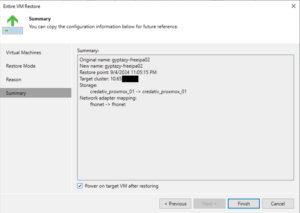 Before finalizing the restore process, review all the settings to make sure they align with your intended outcome. This is your chance to go back and make any necessary adjustments. Once you’re satisfied with the configuration, proceed to restore the VM by clicking Finish.
The restoration process will begin, and its progress can be monitored within the Veeam Backup & Replication console. Depending on the size of the VM and the performance of your backup storage and network, the restoration can take some time.
File-Level-Restore
Open the Veeam Backup & Replication console on your backup server or management workstation. To start creating a backup job, navigate to the Home tab and click on Backup Job, then select Virtual machine from the Disk menu.
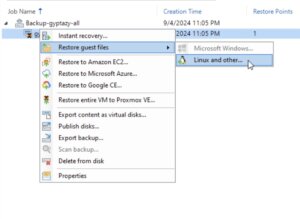 Select Restore guest files. The wizard for file-level recovery will start, guiding you through the necessary steps. The first step involves choosing the VM backup from which you want to restore files. Browse through the list of available backups, select the appropriate one, and then click Next to proceed.
Choose the restore point that you want to use for the file-level restore. This is typically the most recent backup, but you can select an earlier one if needed. After picking the restore point, click Next to continue.
At this stage, you may need to choose the operating system of the VM that you are restoring files from. This is particularly important if the backup is of a different OS than the one on the Veeam Backup & Replication server because it will determine the type of helper appliance required for the restore.
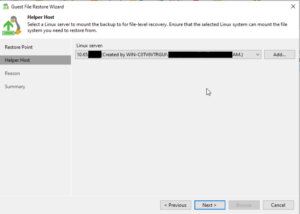 Veeam Backup & Replication will prompt you to deploy a helper appliance if the backup is from an OS that is not natively supported by the Windows-based Veeam Backup & Replication server. Follow the on-screen instructions to deploy the helper appliance, which will facilitate the file-level restore process.
Once the helper appliance is ready, you will be able to browse the file system of the backup. Navigate through the backup to locate the files or folders you wish to restore.
After selecting the files or folders for restoration, you will be prompted to choose the destination where you want to restore the data. You can restore to the original location or specify a new location, depending on your requirements.
 Review your selections to confirm that the correct files are being restored and to the right destination. If everything is in order, proceed with the restoration by clicking Finish.
The file-level restore process will start, and you can monitor the progress within the Veeam Backup & Replication console. The time it takes to complete the restore will depend on the size and number of files being restored, as well as the performance of your backup storage and network.
Conclusion
Summarising all the things, the latest update to Veeam introduces a very important and welcomed integration with Proxmox VE, filling a significant gap for enterprises that have adopted this open-source virtualization platform. By enabling direct backups and restores of entire VMs across different hypervisors without the need for in-VM agents, Veeam now offers unparalleled flexibility and simplicity in managing mixed environments. This advancement not only streamlines operations and enhances data protection strategies but also empowers organizations to easily migrate and evaluate new open-source virtualization platforms like Proxmox VE with minimal risk. It is great to see that more and more companies are putting efforts into supporting open-source solutions which underlines the ongoing importance of open-source based products in enterprises.
Additionally, for those starting fresh with Proxmox, the Proxmox Backup Server remains a viable open-source alternative and you can find our blog post about configuring the Proxmox Backup Server right here. Overall, this update represents a significant step forward in unifying virtualization and backup infrastructures, offering both versatility and ease of integration.
We are always here to help and assist you with further consulting, planning, and integration needs. Whether you are exploring new virtualization platforms, optimizing your current infrastructure, or looking for expert guidance on your backup strategies, our team is dedicated to ensuring your success every step of the way. Do not hesitate to reach out to us for personalized support and tailored solutions to meet your unique requirements in virtualization- or backup environments.
In the world of virtualization, ensuring data redundancy and high availability is crucial. Proxmox Virtual Environment (PVE) is a powerful open-source platform for enterprise virtualization, combining KVM hypervisor and LXC containers. One of the key features that Proxmox offers is local storage replication, which helps in maintaining data integrity and availability in case of hardware failures. In this blog post, we will delve into the concept of local storage replication in Proxmox, its benefits, and how to set it up.
What is Local Storage Replication?
Local storage replication in Proxmox refers to the process of duplicating data from one local storage device to another within the same Proxmox cluster. This ensures that if one storage device fails, the data is still available on another device, thereby minimizing downtime and data loss. This is particularly useful in environments where high availability is critical.
Benefits
- Data Redundancy: By replicating data across multiple storage devices, you ensure that a copy of your data is always available, even if one device fails.
- High Availability: In the event of hardware failure, the system can quickly switch to the replicated data, ensuring minimal disruption to services.
Caveat
Please note that data loss may occur between the last synchronization of the data and the failure of the node. Otherwise use shared storage (Ceph, NFS, …) in a cluster if you can not tolerate any small data loss.
Setting Up Local Storage Replication in Proxmox
Setting up local storage replication in Proxmox involves a few steps. Here’s a step-by-step guide to help you get started:
Step 1: Prepare Your Environment
Ensure that you have a Proxmox cluster set up with at least two nodes. Each node should have local ZFS storage configured.
Step 2: Configure Storage Replication
- Access the Proxmox Web Interface: Log in to the Proxmox web interface.
- Navigate to Datacenter: In the left-hand menu, click on Datacenter.
- Select Storage: Under the Datacenter menu, click on Storage.
- Add Storage: Click on Add and select the type of storage you want to replicate.
- Configure Storage: Fill in the required details for the ZFS storage (one local storage per node).
Step 3: Set Up Replication
- Navigate to the Node: In the left-hand menu, select the node where you want to set up replication.
- Select the VM/CT: Click on the virtual machine (VM) or container (CT) you want to replicate.
- Configure Replication: Go to the Replication tab and click on Add.
- Select Target Node: Choose the target node where the data will be replicated to.
- Schedule Replication: Set the replication schedule according to your needs (e.g. every 5 minutes, hourly).
Step 4: Monitor Replication
Once replication is set up, you can monitor its status in the Replication tab. Proxmox provides detailed logs and status updates to help you ensure that replication is functioning correctly.
Best Practices for Local Storage Replication
- Regular Backups: While replication provides redundancy, it is not a substitute for regular backups. Ensure that you have a robust backup strategy in place. Use tools like the Proxmox Backup Server (PBS) for this task.
- Monitor Storage Health: Regularly check the health of your storage devices to preemptively address any issues.
- Test Failover: Periodically test the failover process to ensure that your replication setup works as expected in case of an actual failure.
- Optimize Replication Schedule: Balance the replication frequency with your performance requirements and network bandwidth to avoid unnecessary load.
Conclusion
Local storage replication in Proxmox is a powerful feature that enhances data redundancy and high availability. By following the steps outlined in this blog post, you can set up and manage local storage replication in your Proxmox environment, ensuring that your data remains safe and accessible even in the face of hardware failures. Remember to follow best practices and regularly monitor your replication setup to maintain optimal performance and reliability.
You can find further information here about the Proxmox storage replication:
https://pve.proxmox.com/wiki/Storage_Replication
https://pve.proxmox.com/pve-docs/chapter-pvesr.html
Happy virtualizing!
With version 256, systemd introduced run0. Lennart Poettering describes run0 as an alternative to sudo and explains on Mastodon at the same time what he sees as the problem with sudo.
In this blog post, however, we do not want to go into the strengths or weaknesses of sudo, but take a closer look at run0 and use it as a sudo alternative.
Unlike sudo, run0 uses neither the configuration file /etc/sudoers nor a SUID bit to extend user permissions. In the background, it uses systemd-run to start new processes, which has been in systemd for several years.
PolKit is used when it comes to checking whether a user has the appropriate permissions to use run0. All rules that the configuration of PolKit provides can be used here. In our example, we will concentrate on a simple variant.
Experimental Setup
For our example, we use an t2.micro EC2 instance with Debian Bookworm. Since run0 was only introduced in systemd version 256 and Debian Bookworm is still delivered with version 252 at the current time, we must first add the Debian Testing Repository.
❯ ssh admin@2a05:d014:ac8:7e00:c4f4:af36:3938:206e
…

admin@ip-172-31-15-135:~$ sudo su -

root@ip-172-31-15-135:~# cat  <
/etc/apt/sources.list.d/testing.list
>  deb https://deb.debian.org/debian testing main
> EOF

root@ip-172-31-15-135:~# apt update
Get:1 file:/etc/apt/mirrors/debian.list Mirrorlist [38 B]
Get:5 file:/etc/apt/mirrors/debian-security.list Mirrorlist [47 B]
Get:7 https://deb.debian.org/debian testing InRelease [169 kB]
Get:2 https://cdn-aws.deb.debian.org/debian bookworm InRelease [151 kB]
…
Fetched 41.3 MB in 6s (6791 kB/s)
Reading package lists... Done
Building dependency tree... Done
Reading state information... Done
299 packages can be upgraded. Run 'apt list --upgradable' to see them.

root@ip-172-31-15-135:~# apt-cache policy systemd
systemd:
Installed: 252.17-1~deb12u1
Candidate: 256.1-2
Version table:
256.1-2 500
500 https://deb.debian.org/debian testing/main amd64 Packages
254.5-1~bpo12+3 100
100 mirror+file:/etc/apt/mirrors/debian.list bookworm-backports/main amd64 Packages
252.22-1~deb12u1 500
500 mirror+file:/etc/apt/mirrors/debian.list bookworm/main amd64 Packages
*** 252.17-1~deb12u1 100
100 /var/lib/dpkg/status
root@ip-172-31-15-135:~# apt-get install systemd
…

root@ip-172-31-15-135:~# dpkg -l | grep systemd
ii libnss-resolve:amd64 256.1-2 amd64 nss module to resolve names via systemd-resolved
ii libpam-systemd:amd64 256.1-2 amd64 system and service manager - PAM module
ii libsystemd-shared:amd64 256.1-2 amd64 systemd shared private library
ii libsystemd0:amd64 256.1-2 amd64 systemd utility library
ii systemd 256.1-2 amd64 system and service manager
ii systemd-cryptsetup 256.1-2 amd64 Provides cryptsetup, integritysetup and veritysetup utilities
ii systemd-resolved 256.1-2 amd64 systemd DNS resolver
ii systemd-sysv 256.1-2 amd64 system and service manager - SysV compatibility symlinks
ii systemd-timesyncd 256.1-2 amd64 minimalistic service to synchronize local time with NTP servers

root@ip-172-31-15-135:~# reboot
…
The user admin is used for the initial login. This user has already been stored in the file /etc/sudoers.d/90-cloud-init-users by cloud-init and can therefore execute any sudo commands without being prompted for a password.
sudo cat /etc/sudoers.d/90-cloud-init-users
# Created by cloud-init v. 22.4.2 on Thu, 27 Jun 2024 09:22:48 +0000

# User rules for admin
admin ALL=(ALL) NOPASSWD:ALL
Analogous to sudo, we now want to enable run0 for the user admin.
Without further configuration, the user admin receives a login prompt asking for the root password. This is the default behavior of PolKit.
admin@ip-172-31-15-135:~$ run0 ==== AUTHENTICATING FOR org.freedesktop.systemd1.manage-units ==== Authentication is required to manage system services or other units. Authenticating as: Debian (admin) Password: Since this does not correspond to the behavior we want, we have to help a little in the form of a PolKit rule. Additional PolKit rules are stored under /etc/polkit-1/rules.d/.
root@ip-172-31-15-135:~# cat  <
/etc/polkit-1/rules.d/99-run0.rules
polkit.addRule(function(action, subject) {
  if (action.id = "org.freedesktop.systemd1.manage-units") {
  if (subject.user === "admin") {
  return polkit.Result.YES;
  }
  }
});
> EOF
The rule used is structured as follows: First, it is checked whether the action listed is org.freedesktop.systemd1.manage-units. If this is the case, it is checked whether the executing user is the user
Alternatively, it could also be checked whether the executing user belongs to a specific group, such as admin or sudo (if (subject.isInGroup("admin")). It would also be conceivable to ask the user for their own password instead of the root password.
The new rule is automatically read in by PolKit and can be used immediately. Via admin can now execute run0 analogously to our initial sudo configuration.
Process Structure
The following listing shows the difference in the call stack between sudo and run0 While in the case of sudo, separate child processes are started, run0 starts a new process via systemd-run.
root@ip-172-31-15-135:~# sudo su -
root@ip-172-31-15-135:~# ps fo tty,ruser,ppid,pid,sess,cmd
TT RUSER PPID PID SESS CMD
pts/2 admin 1484 1514 1484 sudo su -
pts/0 admin 1514 1515 1515 \_ sudo su -
pts/0 root 1515 1516 1515 \_ su -
pts/0 root 1516 1517 1515 \_ -bash
pts/0 root 1517 1522 1515 \_ ps fo tty,ruser,ppid,pid,sess,cmd
admin@ip-172-31-15-135:~$ run0
root@ip-172-31-15-135:/home/admin# ps fo tty,ruser,ppid,pid,sess,cmd
TT RUSER PPID PID SESS CMD
pts/0 root 1 1562 1562 -/bin/bash
pts/0 root 1562 1567 1562 \_ ps fo tty,ruser,ppid,pid,sess,cmd
Conclusion and Note
As the example above has shown, run0 can generally be used as a simple sudo alternative and offers some security-relevant advantages. If run0 prevails over sudo, this will not happen within the next year. Some distributions simply lack a sufficiently up-to-date systemd version. In addition, the configuration of PolKit is not one of the daily tasks for some admins and know-how must first be built up here in order to transfer any existing sudo “constructs”.
In addition, a decisive advantage of run0 should not be ignored: By default, it colors the background red! 😉

If you had the choice, would you rather take Salsa or Guacamole? Let me explain, why you should choose Guacamole over Salsa.
In this blog article, we want to take a look at one of the smaller Apache projects out there called Apache Guacamole. Apache Guacamole allows administrators to run a web based client tool for accessing remote applications and servers. This can include remote desktop systems, applications or terminal sessions. Users can simply access them by using their web browsers. No special client or other tools are required. From there, they can login and access all pre-configured remote connections that have been specified by an administrator.
Thereby, Guacamole supports a wide variety of protocols like VNC, RDP, and SSH. This way, users can basically access anything from remote terminal sessions to full fledged Graphical User Interfaces provided by operation systems like Debian, Ubuntu, Windows and many more.
Convert every window application to a web application
If we spin this idea further, technically every window application that isn’t designed to run as an web application can be transformed to a web application by using Apache Guacamole. We helped a customer to bring its legacy application to Kubernetes, so that other users could use their web browsers to run it. Sure, implementing the application from ground up, so that it follows the Cloud Native principles, is the preferred solution. As always though, efforts, experience and costs may exceed the available time and budget and in that cases, Apache Guacamole can provide a relatively easy way for realizing such projects.
In this blog article, I want to show you, how easy it is to run a legacy window application as a web app on Kubernetes. For this, we will use a Kubernetes cluster created by kind and create a Kubernetes Deployment to make kate – a KDE based text editor – our own web application. It’s just an example, so there might be better application to transform but this one should be fine to show you the concepts behind Apache Guacamole.
So, without further ado, let’s create our kate web application.
Preparation of Kubernetes
Before we can start, we must make sure that we have a Kubernetes cluster, that we can test on. If you already have a cluster, simply skip this section. If not, let’s spin one up by using kind.
kind is a lightweight implementation of Kubernetes that can be run on every machine. It’s written in Go and can be installed like this:
# For AMD64 / x86_64
[ $(uname -m) = x86_64 ] && curl -Lo ./kind https://kind.sigs.k8s.io/dl/v0.22.0/kind-linux-amd64
# For ARM64
[ $(uname -m) = aarch64 ] && curl -Lo ./kind https://kind.sigs.k8s.io/dl/v0.22.0/kind-linux-arm64
chmod +x ./kind
sudo mv ./kind /usr/local/bin/kind
Next, we need to install some dependencies for our cluster. This includes for example docker and kubectl.
$ sudo apt install docker.io kubernetes-client
By creating our Kubernetes Cluster with kind, we need docker because the Kubernetes cluster is running within Docker containers on your host machine. Installing kubectl allows us to access the Kubernetes after creating it.
Once we installed those packages, we can start to create our cluster now. First, we must define a cluster configuration. It defines which ports are accessible from our host machine, so that we can access our Guacamole application. Remember, the cluster itself is operated within Docker containers, so we must ensure that we can access it from our machine. For this, we define the following configuration which we save in a file called cluster.yaml:
kind: Cluster
apiVersion: kind.x-k8s.io/v1alpha4
nodes:
- role: control-plane
  extraPortMappings:
  - containerPort: 30000
    hostPort: 30000
    listenAddress: "127.0.0.1"
    protocol: TCP
Hereby, we basically map the container’s port 30000 to our local machine’s port 30000, so that we can easily access it later on. Keep this in mind because it will be the port that we will use with our web browser to access our kate instance.
Ultimately, this configuration is consumed by kind . With it, you can also adjust multiple other parameters of your cluster besides of just modifying the port configuration which are not mentioned here. It’s worth to take a look kate’s documentation for this.
As soon as you saved the configuration to cluster.yaml, we can now start to create our cluster:
$ sudo kind create cluster --name guacamole --config cluster.yaml
Creating cluster "guacamole" ...
 ✓ Ensuring node image (kindest/node:v1.29.2) 🖼
 ✓ Preparing nodes 📦
 ✓ Writing configuration 📜
 ✓ Starting control-plane 🕹️
 ✓ Installing CNI 🔌
 ✓ Installing StorageClass 💾
Set kubectl context to "kind-guacamole"
You can now use your cluster with:

kubectl cluster-info --context kind-guacamole

Have a question, bug, or feature request? Let us know! https://kind.sigs.k8s.io/#community 🙂
Since we don’t want to run everything in root context, let’s export the kubeconfig, so that we can use it with kubectl by using our unpriviledged user:
$ sudo kind export kubeconfig \
    --name guacamole \
    --kubeconfig $PWD/config

$ export KUBECONFIG=$PWD/config
$ sudo chown $(logname): $KUBECONFIG
By doing so, we are ready and can access our Kubernetes cluster using kubectl now. This is our baseline to start migrating our application.
Creation of the Guacamole Deployment
In order to run our application on Kubernetes, we need some sort of workload resource. Typically, you could create a Pod, Deployment, Statefulset or Daemonset to run workloads on a cluster.
Let’s create the Kubernetes Deployment for our own application. The example shown below shows the deployment’s general structure. Each container definition will have their dedicated examples afterwards to explain them in more detail.
apiVersion: apps/v1
kind: Deployment
metadata:
  labels:
    app: web-based-kate
  name: web-based-kate
spec:
  replicas: 1
  selector:
    matchLabels:
      app: web-based-kate
  template:
    metadata:
      labels:
        app: web-based-kate
    spec:
      containers:
      # The guacamole server component that each
      # user will connect to via their browser
      - name: guacamole-server
        image: docker.io/guacamole/guacamole:1.5.4
        ...
      # The daemon that opens the connection to the
      # remote entity
      - name: guacamole-guacd
        image: docker.io/guacamole/guacd:1.5.4
        ...
      # Our own self written application that we
      # want to make accessible via the web.
      - name: web-based-kate
        image: registry.example.com/own-app/web-based-kate:0.0.1
        ...
      volumes:
        - name: guacamole-config
          secret:
            secretName: guacamole-config
        - name: guacamole-server
          emptyDir: {}
        - name: web-based-kate-home
          emptyDir: {}
        - name: web-based-kate-tmp
          emptyDir: {}
As you can see, we need three containers and some volumes for our application. The first two containers are dedicated to Apache Guacamole itself. First, it’s the server component which is the external endpoint for clients to access our web application. It serves the web server as well as the user management and configuration to run Apache Guacamole.
Next to this, there is the guacd daemon. This is the core component of Guacamole which creates the remote connections to the application based on the configuration done to the server. This daemon forwards the remote connection to the clients by making it accessible to the Guacamole server which then forwards the connection to the end user.
Finally, we have our own application. It will offer a connection endpoint to the guacd daemon using one of Guacamole’s supported protocols and provide the Graphical User Interface (GUI).
Guacamole Server
Now, let’s deep dive into each container specification. We are starting with the Guacamole server instance. This one handles the session and user management and contains the configuration which defines what remote connections are available and what are not.
- name: guacamole-server
  image: docker.io/guacamole/guacamole:1.5.4
  env:
    - name: GUACD_HOSTNAME
      value: "localhost"
    - name: GUACD_PORT
      value: "4822"
    - name: GUACAMOLE_HOME
      value: "/data/guacamole/settings"
    - name: HOME
      value: "/data/guacamole"
    - name: WEBAPP_CONTEXT
      value: ROOT
  volumeMounts:
    - name: guacamole-config
      mountPath: /data/guacamole/settings
    - name: guacamole-server
      mountPath: /data/guacamole
  ports:
    - name: http
      containerPort: 8080
  securityContext:
    allowPrivilegeEscalation: false
    privileged: false
    readOnlyRootFilesystem: true
    capabilities:
      drop: ["all"]
  resources:
    limits:
      cpu: "250m"
      memory: "256Mi"
    requests:
      cpu: "250m"
      memory: "256Mi"
Since it needs to connect to the guacd daemon, we have to provide the connection information for guacd by passing them into the container using environment variables like GUACD_HOSTNAME or GUACD_PORT. In addition, Guacamole would usually be accessible via http://<your domain>/guacamole.
This behavior however can be adjusted by modifying the WEBAPP_CONTEXT environment variable. In our case for example, we don’t want a user to type in /guacamole to access it but simply using it like this http://<your domain>/
Guacamole Guacd
Then, there is the guacd daemon.
- name: guacamole-guacd
  image: docker.io/guacamole/guacd:1.5.4
  args:
    - /bin/sh
    - -c
    - /opt/guacamole/sbin/guacd -b 127.0.0.1 -L $GUACD_LOG_LEVEL -f
  securityContext:
    allowPrivilegeEscalation: true
    privileged: false
    readOnlyRootFileSystem: true
    capabilities:
      drop: ["all"]
  resources:
    limits:
      cpu: "250m"
      memory: "512Mi"
    requests:
      cpu: "250m"
      memory: "512Mi"
It’s worth mentioning that you should modify the arguments used to start the guacd container. In the example above, we want guacd to only listen to localhost for security reasons. All containers within the same pod share the same network namespace. As a a result, they can access each other via localhost. This said, there is no need to make this service accessible to over services running outside of this pod, so we can limit it to localhost only. To achieve this, you would need to set the -b 127.0.0.1 parameter which sets the corresponding listen address. Since you need to overwrite the whole command, don’t forget to also specify the -L and -f parameter. The first parameter sets the log level and the second one set the process in the foreground.
Web Based Kate
To finish everything off, we have the kate application which we want to transform to a web application.
- name: web-based-kate
  image: registry.example.com/own-app/web-based-kate:0.0.1
  env:
    - name: VNC_SERVER_PORT
      value: "5900"
    - name: VNC_RESOLUTION_WIDTH
      value: "1280"
    - name: VNC_RESOLUTION_HEIGHT
      value: "720"
  securityContext:
    allowPrivilegeEscalation: true
    privileged: false
    readOnlyRootFileSystem: true
    capabilities:
      drop: ["all"]
  volumeMounts:
    - name: web-based-kate-home
      mountPath: /home/kate
    - name: web-based-kate-tmp
      mountPath: /tmp
Configuration of our Guacamole setup
After having the deployment in place, we need to prepare the configuration for our Guacamole setup. In order to know, what users exist and which connections should be offered, we need to provide a mapping configuration to Guacamole.
In this example, a simple user mapping is shown for demonstration purposes. It uses a static mapping defined in a XML file that is handed over to the Guacamole server. Typically, you would use other authentication methods instead like a database or LDAP.
This said however, let’s continue with our static one. For this, we simply define a Kubernetes Secret which is mounted into the Guacamole server. Hereby, it defines two configuration files. One is the so called guacamole.properties. This is Guacamole’s main configuration file. Next to this, we also define the user-mapping.xml which contains all available users and their connections.
apiVersion: v1
kind: Secret
metadata:
  name: guacamole-config
stringData:
  guacamole.properties: |
    enable-environment-properties: true
  user-mapping.xml: |
    <user-mapping>
      <authorize username="admin" password="PASSWORD" encoding="sha256">
        <connection name="web-based-kate">
          <protocol>vnc</protocol>
          <param name="hostname">localhost</param>
          <param name="port">5900</param>
        </connection>
      </authorize>
    </user-mapping>
As you can see, we only defined on specific user called admin which can use a connection called web-based-kate. In order to access the kate instance, Guacamole would use VNC as the configured protocol. To make this happen, our web application must offer a VNC Server port on the other side, so that the guacd daemon can then access it to forward the remote session to clients. Keep in mind that you need to replace the string PASSWORD to a proper sha256 sum which contains the password. The sha256 sum could look like this for example:
$ echo -n "test" | sha256sum
9f86d081884c7d659a2feaa0c55ad015a3bf4f1b2b0b822cd15d6c15b0f00a08  -
Next, the hostname parameter is referencing the corresponding VNC server of our kate container. Since we are starting our container alongside with our Guacamole containers within the same pod, the Guacamole Server as well as the guacd daemon can access this application via localhost. There is no need to set up a Kubernetes Service in front of it since only guacd will access the VNC server and forward the remote session via HTTP to clients accessing Guacamole via their web browsers. Finally, we also need to specify the VNC server port which is typically 5900 but this could be adjusted if needed.
The corresponding guacamole.properties is quite short. By enabling the enabling-environment-properties configuration parameter, we make sure that every Guacamole configuration parameter can also be set via environment variables. This way, we don’t need to modify this configuration file each and every time when we want to adjust the configuration but we only need to provide updated environment variables to the Guacamole server container.
Make Guacamole accessible
Last but not least, we must make the Guacamole server accessible for clients. Although each provided service can access each other via localhost, the same does not apply to clients trying to access Guacamole. Therefore, we must make Guacamole’s server port 8080 available to the outside world. This can be achieved by creating a Kubernetes Service of type NodePort. This service is forwarding each request from a local node port to the corresponding container that is offering the configured target port. In our case, this would be the Guacamole server container which is offering port 8080.
apiVersion: v1
kind: Service
metadata:
  name: web-based-kate
spec:
  type: NodePort
  selector:
    app: web-based-kate
  ports:
    - name: http
      protocol: TCP
      port: 8080
      targetPort: 8080
      nodePort: 30000
This specific port is then mapped to the Node’s 30000 port for which we also configured the kind cluster in such a way that it forwards its node port 30000 to the host system’s port 30000. This port is the one that we would need to use to access Guacamole with our web browsers.
Prepartion of the Application container
Before we can start to deploy our application, we need to prepare our kate container. For this, we simply create a Debian container that is running kate. Keep in mind that you would typically use lightweight base images like alpine to run applications like this. For this demonstration however, we use the Debian images since it is easier to spin it up but in general you only need a small friction of the functionality that is provided by this base image. Moreover – from an security point of view – you want to keep your images small to minimize the attack surface and make sure it is easier to maintain. For now however, we will continue with the Debian image.
In the example below, you can see a Dockerfile for the kate container.
FROM debian:12

# Install all required packages
RUN apt update && \
    apt install -y x11vnc xvfb kate

# Add user for kate
RUN adduser kate --system --home /home/kate -uid 999

# Copy our entrypoint in the container
COPY entrypoint.sh /opt

USER 999
ENTRYPOINT [ "/opt/entrypoint.sh" ]
Here you see that we create a dedicated user called kate (User ID 999) for which we also create a home directory. This home directory is used for all files that kate is creating during runtime. Since we set the readOnlyRootFilesystem to true, we must make sure that we mount some sort of writable volume (e.g EmptyDir) to kate’s home directory. Otherwise, kate wouldn’t be able to write any runtime data then.
Moreover, we have to install the following three packages:
- x11vnc
- xvfb
- kate
These are the only packages we need for our container. In addition, we also need to create an entrypoint script to start the application and prepare the container accordingly. This entrypoint script creates the configuration for kate, starts it in a virtual display by using xvfb-run and provides this virtual display to end users by using the VNC server via x11vnc. In the meantime, xdrrinfo is used to check if the virtual display came up successfully after starting kate. If it takes to long, the entrypoint script will fail by returning the exit code 1.
By doing this, we ensure that the container is not stuck in an infinite loop during a failure and let Kubernetes restart the container whenever it couldn’t start the application successfully. Furthermore, it is important to check if the virtual display came up prior of handing it over to the VNC server because the VNC server would crash if the virtual display is not up and running since it needs something to share. On the other hand though, our container will be killed whenever kate is terminated because it would also terminate the virtual display and in the end it would then also terminate the VNC server which let’s the container exit, too. This way, we don’t need take care of it by our own.
#!/bin/bash

set -e

# If no resolution is provided
if [ -z $VNC_RESOLUTION_WIDTH ]; then
  VNC_RESOLUTION_WIDTH=1920
fi

if [ -z $VNC_RESOLUTION_HEIGHT ]; then
  VNC_RESOLUTION_HEIGHT=1080
fi

# If no server port is provided
if [ -z $VNC_SERVER_PORT ]; then
  VNC_SERVER_PORT=5900
fi

# Prepare configuration for kate
mkdir -p $HOME/.local/share/kate
echo "[MainWindow0]
"$VNC_RESOLUTION_WIDTH"x"$VNC_RESOLUTION_HEIGHT" screen: Height=$VNC_RESOLUTION_HEIGHT
"$VNC_RESOLUTION_WIDTH"x"$VNC_RESOLUTION_HEIGHT" screen: Width=$VNC_RESOLUTION_WIDTH
"$VNC_RESOLUTION_WIDTH"x"$VNC_RESOLUTION_HEIGHT" screen: XPosition=0
"$VNC_RESOLUTION_WIDTH"x"$VNC_RESOLUTION_HEIGHT" screen: YPosition=0
Active ViewSpace=0
Kate-MDI-Sidebar-Visible=false" > $HOME/.local/share/kate/anonymous.katesession

# We need to define an XAuthority file
export XAUTHORITY=$HOME/.Xauthority

# Define execution command
APPLICATION_CMD="kate"

# Let's start our application in a virtual display
xvfb-run \
  -n 99 \
  -s ':99 -screen 0 '$VNC_RESOLUTION_WIDTH'x'$VNC_RESOLUTION_HEIGHT'x16' \
  -f $XAUTHORITY \
  $APPLICATION_CMD &

# Let's wait until the virtual display is initalize before
# we proceed. But don't wait infinitely.
TIMEOUT=10
while ! (xdriinfo -display :99 nscreens); do
  sleep 1
  let TIMEOUT-=1
done

# Now, let's make the virtual display accessible by
# exposing it via the VNC Server that is listening on
# localhost and the specified port (e.g. 5900)
x11vnc \
  -display :99 \
  -nopw \
  -localhost \
  -rfbport $VNC_SERVER_PORT \
  -forever
After preparing those files, we can now create our image and import it to our Kubernetes cluster by using the following commands:
# Do not forget to give your entrypoint script
# the proper permissions do be executed
$ chmod +x entrypoint.sh

# Next, build the image and import it into kind,
# so that it can be used from within the clusters.
$ sudo docker build -t registry.example.com/own-app/web-based-kate:0.0.1 .
$ sudo kind load -n guacamole docker-image registry.example.com/own-app/web-based-kate:0.0.1
The image will be imported to kind, so that every workload resource operated in our kind cluster can access it. If you use some other Kubernetes cluster, you would need to upload this to a registry that your cluster can pull images from.
Finally, we can also apply our previously created Kubernetes manifests to the cluster. Let’s say we saved everything to one file called kuberentes.yaml. Then, you can simply apply it like this:
$ kubectl apply -f kubernetes.yaml
deployment.apps/web-based-kate configured
secret/guacamole-config configured
service/web-based-kate unchanged
This way, a Kubernetes Deployment, Secret and Service is created which ultimately creates a Kubernetes Pod which we can access afterwards.
$ kubectl get pod
NAME                              READY   STATUS    RESTARTS   AGE
web-based-kate-7894778fb6-qwp4z   3/3     Running   0          10m
Verification of our Deployment
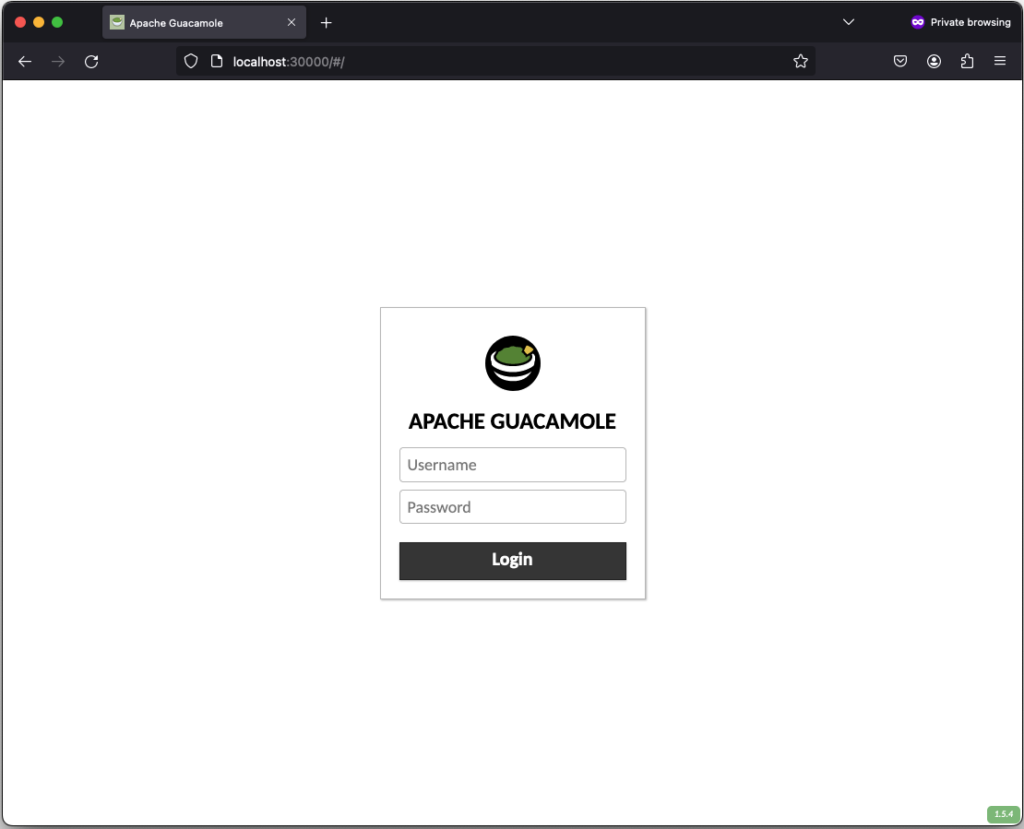
Now, it’s money time! After preparing everything, we should be able to access our web based kate application by using our web browser. As mentioned earlier, we configured kind in such a way that we can access our application by using our local port 30000. Every request to this port is forwarded to the kind control plane node from where it is picked up by the Kubernetes Service of type NodePort. This one is then forwarding all requests to our designated Guacamole server container which is offering the web server for accessing remote application’s via Guacamole.
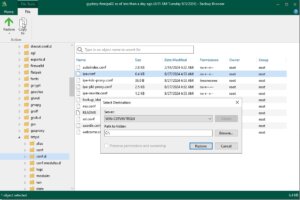
If everything works out, you should be able to see the the following login screen:
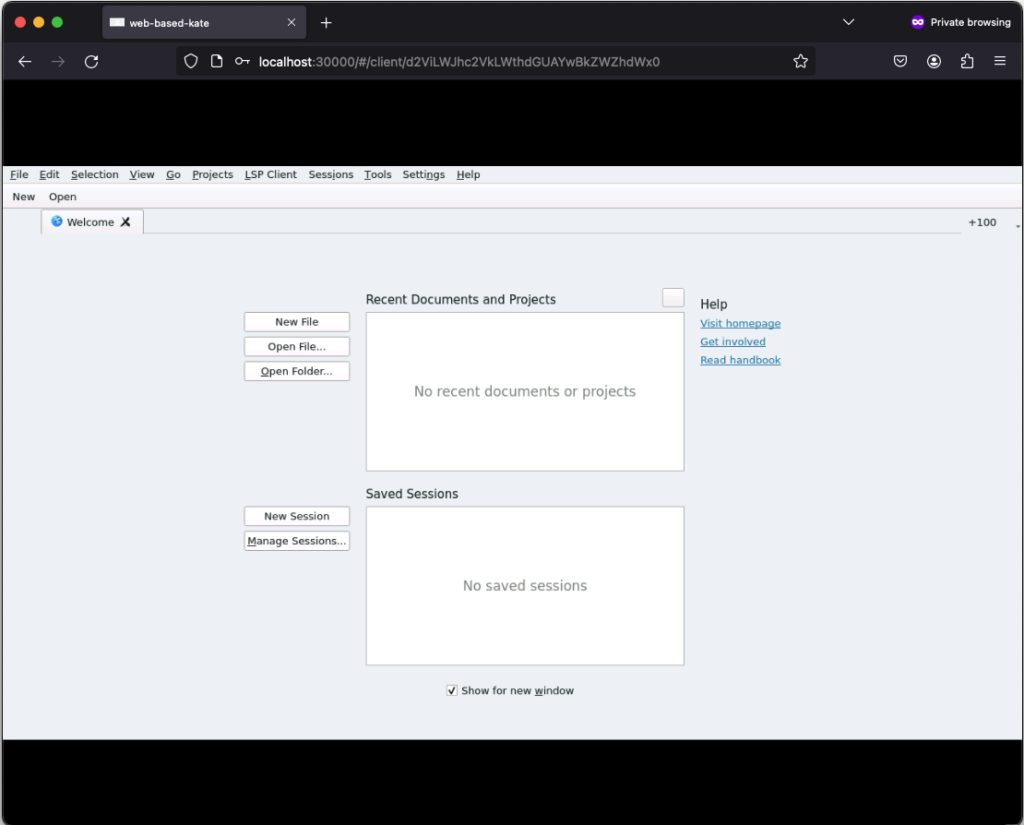
After successfully login in, the remote connection is established and you should be able to see the welcome screen from kate:
If you click on New, you can create a new text file:
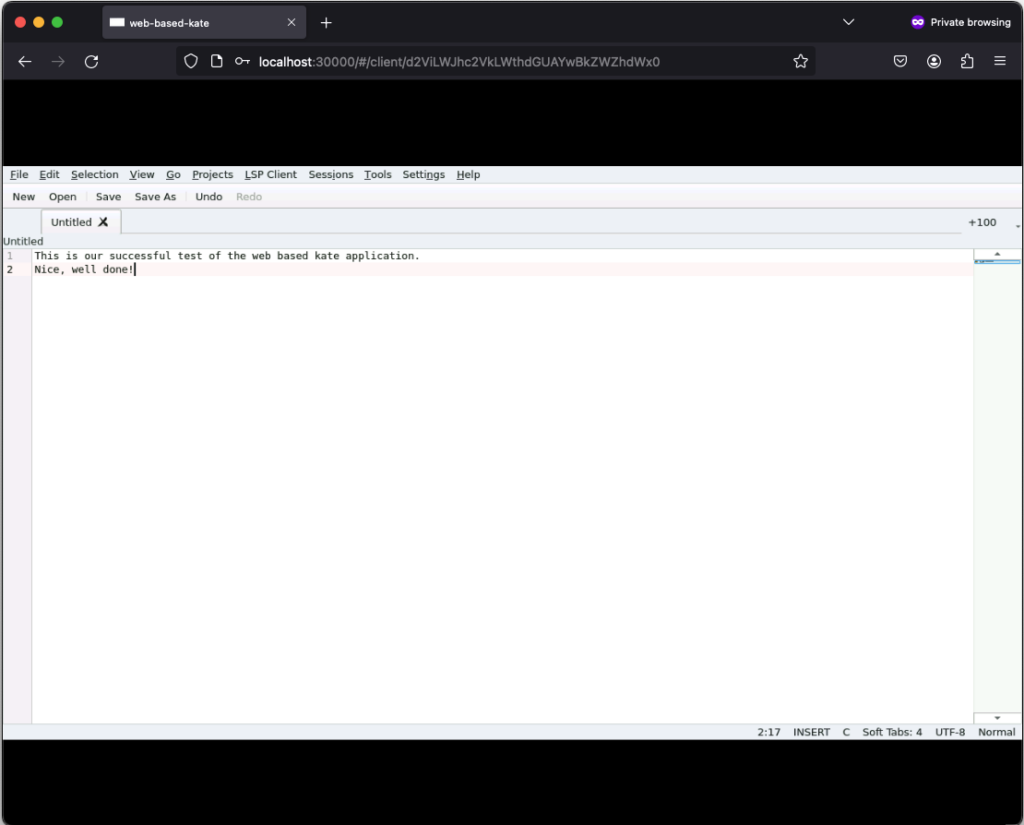
Those text files can even be saved but keep in mind that they will only exist as long as our Kubernetes Pod exists. Once it gets deleted, the corresponding EmptyDir, that we mounted into our kate container, gets deleted as well and all files in it are lost. Moreover, the container is set to read-only meaning that a user can only write files to the volumes (e.g. EmptyDir) that we mounted to our container.
Conclusion
After seeing that it’s relatively easy to convert every application to a web based one by using Apache Guacamole, there is only one major question left…
What do you prefer the most. Salsa or Guacamole?
Integrating Proxmox Backup Server into Proxmox Clusters
Proxmox Backup Server
In today’s digital landscape, where data reigns supreme, ensuring its security and integrity is paramount for businesses of all sizes. Enter Proxmox Backup Server, a robust solution poised to revolutionize data protection strategies with its unparalleled features and open-source nature.

At its core, Proxmox Backup Server is a comprehensive backup solution designed to safeguard critical data and applications effortlessly in virtualized environments based on Proxmox VE. Unlike traditional backup methods, Proxmox Backup Server offers a streamlined approach, simplifying the complexities associated with data backup and recovery.
One of the standout features of Proxmox Backup Server is its seamless integration with Proxmox Virtual Environment (PVE), creating a cohesive ecosystem for managing virtualized environments. This integration allows for efficient backup and restoration of Linux containers and virtual machines, ensuring minimal downtime and maximum productivity. Without the need of any backup clients on each container or virtual machine, this solution still offers the back up and restore the entire system but also single files directly from the filesystem.
Proxmox Backup Server provides a user friendly interface, making it accessible to both seasoned IT professionals and newcomers alike. With its intuitive design, users can easily configure backup tasks, monitor progress, and retrieve data with just a few clicks, eliminating the need for extensive training or technical expertise.
Data security is a top priority for businesses across industries and Proxmox Backup Server delivers on this front. Bundled with solutions like ZFS it also brings in all the enterprise filesystem features like encryption at rest, encryption at transition, checksums, snapshots, deduplication and compression but also integrating iSCSI or NFS storage from enterprise storage solutions like from NetApp can be used.
Another notable aspect of Proxmox Backup Server is its cost effectiveness. As an open-source solution, it eliminates the financial barriers (also in addition with the Proxmox VE solutions) associated with proprietary backup software.
Integrating Proxmox Backup Server into Proxmox Clusters
General
This guide expects you to have already at least one Proxmox VE system up and running and also a system where a basic installation of Proxmox Backup Server has been performed. Within this example, the Proxmox Backup Server is installed on a single disk, where the datastore gets attached to an additional block device holding the backups. Proxmox VE and Proxmox Backup Server instances must not be in the same network but must be reachable for each other. The integration requires administrative access to the datacenter of the Proxmox VE instance(s) and the Backup Server.
Prerequisites
- Proxmox VE (including the datacenter).
- Proxmox Backup Server (basic installation).
- Administrative access to all systems.
- Network reachability.
- Storage device holding the backups (in this case a dedicated block storage device).
Administration: Proxmox Backup Server
Like the Proxmox VE environment, the Proxmox Backup Server comes along with a very intuitive web frontend. Unlike the web frontend of Proxmox VE, which runs on tcp/8006, the Proxmox Backup Server can be reached on tcp/8007. Therefore, all next tasks will be done on https://<IP-PROXMOX-BACKUP-SERVER>:8007.
After logging in to the web frontend, the dashboard overview welcomes the user.

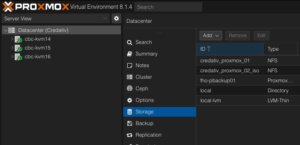
Adding Datastore / Managing Storage
The initial and major tasks relies in managing the storage and adding a usable datastore for the virtualization environment holding the backup data. Therefore, we switch to the Administration chapter and click on Storage / Disks. This provides an overview of the available Devices on the Proxmox Backup Server.  As already being said, this example uses a dedicated block storage device which will be used with ZFS to benefit from checksums, deduplication, compression which of course can also be used in addition with multiple disks (so called raidz-levels) or with other solutions like folder or NFS shares. Coming back to our example, we can see the empty /dev/sdb device which will be used to store all backup files.
By clicking on ZFS in the top menu bar, a ZFS trunk can be created as a datastore. Within this survey, a name, the raid level, compression and the devices to use must be defined. 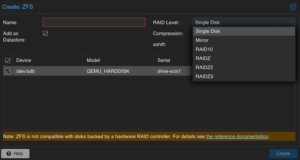 As already mentioned, we can attach multiple disks and define a desired raid level. The given example only consists of a single disk, which will be defined here. Compression is optional, but using LZ4 as a compression is recommended. As a lossless data compression algorithm, LZ4 aims to provide a good trade off between speed and compression ratio which is very transparent on today’s system.
Ensure to check Add as Datastore option (default) will create the given name directly as a usable datastore. In our example this will be backup01.
Keep in mind, that this part is not needed when using a NFS share. Also do not use this in addition with hardware RAID controllers.
Adding User for Backup
In a next step, a dedicated user will be created that will be used for the datastore permissions and for the Proxmox VE instances for authentication and authorization. This allows even complex setups with different datastores, different users including different access levels (e.g., reading, writing, auditing,…) on different clusters and instances. To keep it simple for demonstrations, just a single user for everything will be used.
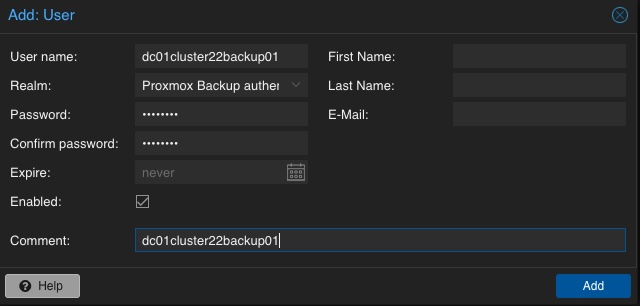 A new user is configured by selecting Configuration, Access Control and User Management in the left menu. There, a new user can be created by simply defining a name and a password. The default realm should stay on the default for the Proxmox Backup authentication provider. Depending on the complexity of the used name schema, you may also create reasonable users. In the given example, the user is called dc01cluster22backup01.
Adding Permission of User for Datastore
Mentioning already the possibility to create complex setups regarding authentication and authorization, the datastore must be linked to at least a single user that can access it. Therefore, we go back to the Datastore and select the previously created backup01 datastore. In the top menu bar, the permissions can be created and adjusted in the Permissions chapter. Initially, a new one will be created now. Within the following survey the datastore or path, the user and the role must be defined:
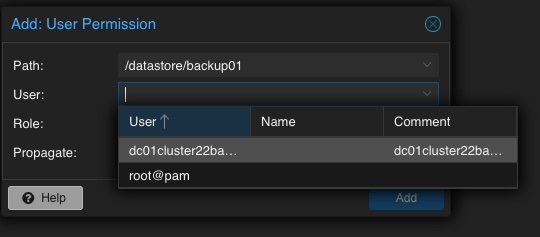
Path: /datastore/backup01
User: dc01cluster22backup01@pbs
Role: DatastoreAdmin
Propagate: True
To provide a short overview of the possible roles, this will be shortly mentioned without any further explanation: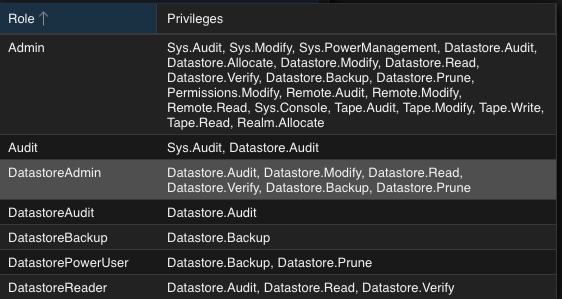
- Admin
- Audit
- DatastoreAdmin
- DatastoreAudit
- DatastoreBackup
- DatastorePowerUser
- DatastoreReader
Administration: Proxmox VE
The integration of the backup datastore will be performed from the Proxmox VE instances via the Datacenter. As a result, the Proxmox VE web frontend will now be used for further administrative actions. The Proxmox VE web frontend runs on tcp/8006, Therefore, all next tasks will be done on https://<IP-PROXMOX-VE-SERVER>:8006.
Adding Storage
 Integrating the Proxmox Backup Server works the same way like managing and adding a shared storage to a Proxmox datacenter.
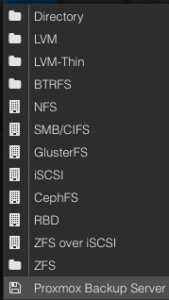
In the left menu we choose the active datacenter and select the Storage options. There, we can find all natively support storage options like (NFS, SMB/CIFS, iSCSI, ZFS, GlusterFS,…) of Proxmox and finally select the Proxmox Backup Server as a dedicated item.
Afterwards, the details for adding this datastore to the datacenter must be inserted. The following options need to be defined:
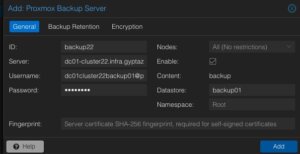 ID: backup22
Server: <FQDN-OR-IP-OF-BACKUP-SERVER>
Username: dc01cluster22backup01@pbs
Password: <THE-PASSWORD-OF-THE-USER>
Enable: True
Datastore: backup01
Fingerprint: <SYSTEM-FINGERPRINT-OF-BACKUP-SERVER>
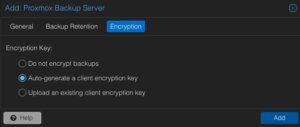 Optionally, also the Backup Retention and Encryption can be configured before adding the new backup datastore. While the backup retention can also be configured on the Proxmox Backup Server (which is recommended), enabling the encryption should be considered. Selecting an d activating the encryption is easily done by simply setting it to Auto-generate a client encryption key. Depending on your previous setup, also an already present key can be uploaded and used.
After adding this backup datastore to the datacenter, this can immediately be used for backup and the integration is finalized.
Conclusion
Proxmox provides with the Proxmox Backup Server an enterprise backup solution, for backing up Linux containers and virtual machines. Supporting features like incremental and fully deduplicated backups by using the benefits of different open-source solutions, in addition with strong encryption and data integrity this solution is a prove that open-source software can compete with closed-source enterprise software. Together with Proxmox VE, enterprise like virtualization environments can be created and managed without missing the typical enterprise feature set. Proxmox VE and the Proxmox Backup Server can also be used in addition to storage appliances from vendors like NetApp, by directly use iSCSI or NFS.
Providing this simple example, there are of course much more complex scenarios which can be created and also should be considered. We are happy to provide you more information and to assist you creating such setups. We also provide help for migrating from other products to Proxmox VE setups. Feel free to contact us at any time for more information.
Migrating VMs from VMware ESXi to Proxmox
In response to Broadcom’s recent alterations in VMware’s subscription model, an increasing number of enterprises are reevaluating their virtualization strategies. With heightened concerns over licensing costs and accessibility to features, businesses are turning towards open source solutions for greater flexibility and cost-effectiveness. Proxmox VE, in particular, has garnered significant attention as a viable alternative. Renowned for its robust feature set and open architecture, Proxmox offers a compelling platform for organizations seeking to mitigate the impact of proprietary licensing models while retaining comprehensive virtualization capabilities. This trend underscores a broader industry shift towards embracing open-source technologies as viable alternatives in the virtualization landscape. Just to mention, Proxmox is widely known as a viable alternative to VMware ESXi but there are also other options available, such as bhyve which we also covered in one of our blog posts.
Benefits of Opensource Solutions
In the dynamic landscape of modern business, the choice to adopt open source solutions for virtualization presents a strategic advantage for enterprises. With platforms like KVM, Xen and even LXC containers, organizations can capitalize on the absence of license fees, unlocking significant cost savings and redirecting resources towards innovation and growth. This financial flexibility empowers companies to make strategic investments in their IT infrastructure without the burden of proprietary licensing costs. Moreover, open source virtualization promotes collaboration and transparency, allowing businesses to tailor their environments to suit their unique needs and seamlessly integrate with existing systems. Through community-driven development and robust support networks, enterprises gain access to a wealth of expertise and resources, ensuring the reliability, security, and scalability of their virtualized infrastructure. Embracing open source virtualization not only delivers tangible financial benefits but also equips organizations with the agility and adaptability needed to thrive in an ever-evolving digital landscape.
Migrating a VM
Prerequisites
To ensure a smooth migration process from VMware ESXi to Proxmox, several key steps must be taken. First, SSH access must be enabled on both the VMware ESXi host and the Proxmox host, allowing for remote management and administration. Additionally, it’s crucial to have access to both systems, facilitating the migration process. Furthermore, establishing SSH connectivity between VMware ESXi and Proxmox is essential for seamless communication between the two platforms. This ensures efficient data transfer and management during migration. Moreover, it’s imperative to configure the Proxmox VE system or cluster in a manner similar to the ESXi setup, especially concerning networking configurations. This includes ensuring compatibility with VLANs or VXLANs for more complex setups. Additionally, both systems should either run on local storage or have access to shared storage, such as NFS, to facilitate the transfer of virtual machine data. Lastly, before initiating the migration, it’s essential to verify that the Proxmox system has sufficient available space to accommodate the imported virtual machine, ensuring a successful transition without storage constraints.
Activate SSH on ESXi
The SSH server must be activated in order to copy the content from the ESXi system to the new location on the Proxmox server. The virtual machine will later be copied from the Proxmox server. Therefore, it is necessary that the Proxmox system can establish an SSH connection on tcp/22 to the ESXi system:
- Log in to the VMware ESXi host.
- Navigate to Configuration > Security Profile.
- Enable SSH under Services.
Find Source Information about VM on ESXi

One of the challenging matters in finding the location of the virtual machine holding the virtual machine disk. The path can be found within the web UI of the ESXi system:
- Locate the ESXi node that runs the Virtual Machine that should be migrated
- Identify the virtual machine to be migrated (e.g., pgsql07.gyptazy.ch).
- Obtain the location of the virtual disk (VMDK) associated with the VM from the configuration panel.
- The VM location path should be shown (e.g., /vmfs/volumes/137b4261-68e88bae-0000-000000000000/pgsql07.gyptazy.ch).
- Stop and shutdown the VM.
Create a New Empty VM on Proxmox
- Create a new empty VM in Proxmox.
- Assign the same resources like in the ESXi setup.
- Set the network type to VMware vmxnet3.
- Ensure the needed network resources (e.g., VLAN, VXLAN) are properly configured.
- Set the SCSCI controller for the disk to VMware PVSCSI.
- Do not create a new disk (this will be imported later from the ESXi source).
- Each VM gets an ID assigned by Proxmox (note it down, it will be needed later).
Copy VM from ESXi to Proxmox
The content of the virtual machine (VM) will be transferred from the ESXi to the Proxmox system using the open source tool rsync for efficient synchronization and copying. Therefore, the following commands need to be executed from the Proxmox system, where we create a temporary directory to store the VM’s content:
mkdir /tmp/migration_pgsql07.gyptazy.ch
cd /tmp/migration_pgsql07.gyptazy.ch
rsync -avP root@esx02-test.gyptazy.ch:/vmfs/volumes/137b4261-68e88bae-0000-000000000000/pgsq07.gyptazy.ch/* .
Depending on the file size of them virtual machine and the network connectivity this process may take some time.
Import VM in Proxmox
 Afterwards, the disk is imported using the qm utility, defining the VM ID (which got created during the VM creation process), along with specifying the disk name (which has been copied over) and the destination data storage on the Proxmox system where the VM disk should be stored:
qm disk import 119 pgsql07.gyptazy.ch.vmdk local-lvm
Depending on the creation format of the VM or the exporting format there may be multiple disk files which may also be suffixed by _flat. This procedure needs to be repeated by all available disks.
Starting the VM
In the final step, all settings, resources, definitions and customizations of the system should be thoroughly reviewed. One validated, the VM can be launched, ensuring that all components are correctly configured for operation within the Proxmox environment.
Conclusion
This article only covers one of many possible methods for migrations in simple, standalone setups. In more complex environments involving multiple host nodes and different storage systems like fibre channel or network storage, there are significant differences and additional considerations. Additionally, there may be specific requirements regarding availability and Service Level Agreements (SLAs) to be concern. This may be very specific for each environment. Feel free to contact us for personalized guidance on your specific migration needs at any time. We are also pleased to offer our support in related areas in open source such as virtualization (e.g., OpenStack, VirtualBox) and topics pertaining to cloud migrations.
Addendum
On the 27th of March, Proxmox released their new import wizard (pve-esxi-import-tools) which makes migrations from VMware ESXi instances to a Proxmox environment much easier. Within an upcoming blog post we will provide more information about the new tooling and cases where this might be more useful but also covering the corner cases where the new import wizard cannot be used.
As described in the previous post, access control on Unix-like systems is traditionally based on the principle of Discretionary Access Control (DAC). Applications and services run under a specific user and group ID and are granted the corresponding access rights to files and folders.
AppArmor implements a Mandatory Access Control for Linux, based on the Linux Security Modules: an access control strategy that allows specific rights to be granted or denied to individual programs. This security layer exists in addition to the traditional DAC.
Since Debian 10 buster, AppArmor has been included and activated in the kernel by default. The packages apparmor and apparmor-utils provide tools for creating and maintaining AppArmor profiles.
Included Profiles
The two packages mentioned do not come with ready-made profiles, but only the Abstractions mentioned in the previous article: collections of rules that can be included in multiple profiles.
Some programs include their profiles in their own packages, while others contain profiles if corresponding modules are installed later – for example, mod_apparmor for the Apache web server.
The packages apparmor-profiles and apparmor-profiles-extra contain AppArmor profiles that can be found after installation in the directories /etc/apparmor.d (for tested profiles) and /usr/share/apparmor/extra-profiles (for experimental profiles), respectively. These profiles can be used as a basis for custom profiles.
Create Profiles Yourself
While at least experimental profiles are available for most common server services, such as the Apache web server, nothing can be found for the nginx web server. However, this is not a major issue, as a new AppArmor profile can be quickly created with the help of apparmor-utils.
Nginx Example
The following assumes a simple base installation of nginx that only serves HTML files under /var/www/html via HTTP. The focus here is primarily on the general approach, so repetitive steps will be skipped.
The described approach can be applied to any other program. To find out about the paths and files used by a program, dpkg can be used with the -L option, which lists all paths of a package. It should be noted that several packages may need to be queried for this; for nginx, the package of the same name provides hardly any useful information; this is only obtained with the nginx-common package:
# dpkg -L nginx-common
For the following steps, it is recommended to have two terminals open with root privileges.
Before the web server process can be observed for profile creation, all its running processes must be terminated:
# systemctl stop nginx
Once all processes are stopped, aa-genprof is called in the second terminal with the path of the web server’s program file:
# aa-genprof /usr/sbin/nginx
Some information about the current call of aa-genprof appears, including the hint Profiling: /usr/sbin/nginx, followed by Please start the application to be profiled in another window and exercise its functionality now.
To comply with this, the web server process is restarted in the first terminal window:
# systemctl start nginx
Before calling the S option in the second window to search the log files for AppArmor events, the web server should run for a few moments, and it should also be accessed from a browser so that as many typical activities of the process as possible are recorded.
Once this is done, the log files can be searched for events by pressing the S key:
[(S)can system log for AppArmor events] / (F)inish
Reading log entries from /var/log/syslog.
Updating AppArmor profiles in /etc/apparmor.d.
Complain-mode changes:
If an event is found, the affected profile and the action recorded by AppArmor are displayed:
Profile: /usr/sbin/nginx
Capability: dac_override
Severity: 9

 [1 - capability dac_override,]
(A)llow / [(D)eny] / (I)gnore / Audi(t) / Abo(r)t / (F)inish
Here, the program /usr/sbin/nginx requests the Capability dac_override, which was already described in the last article. It is indispensable for the operation of the web server and is allowed by pressing A. Alternatively, the request can be denied with D or ignored with I. With the Audit option, this request would continue to be recorded in the log file during operation.
Profile: /usr/sbin/nginx Capability: net_bind_service Severity: 8 [1 - #include] 2 - capability net_bind_service,
The next event shows that the process requests the Capability net_bind_service, which is needed to open a port with a port number less than 1024.
Unlike the first query, there are two ways to allow access in the future: the first option involves integrating Abstractions for NIS, the Network Information Service. In this Abstraction, which can be found under /etc/apparmor.d/abstractions/nis, in addition to a rule that allows access to rule sets for NIS, the Capability net_bind_service is also listed.
However, since the HTTP server does not include NIS functionality, it is sufficient to only allow the Capability. By pressing 2 and A, this is adopted into the profile.
The same applies to the Abstractions proposed in the following steps for dovecot and postfix: here it is sufficient to only allow the Capabilities setgid and setuid.
Sometimes the designation of the Abstractions can be somewhat misleading: for example, the Abstraction nameservice contains, in addition to rules that allow read access to common nameservice files like passwd or hosts, also rules that permit network access. It is therefore always worthwhile to take a look at the respective file under /etc/apparmor.d/abstractions/ to see if including the Abstraction is beneficial.
After the web server process has received all necessary Capabilities, it apparently tries to open its error log file /var/log/nginx/log with write permissions. It is noticeable here that, in addition to the usual Allow, Deny, and Ignore, the options Glob and Glob with Extension have been added.
Profile: /usr/sbin/nginx
Path: /var/log/nginx/error.log
New Mode: w
Severity: 8

 [1 - /var/log/nginx/error.log w,]
(A)llow / [(D)eny] / (I)gnore / (G)lob / Glob with (E)xtension / (N)ew / Audi(t) / Abo(r)t / (F)inish
Entering E adds another suggestion to the list:
 1 - /var/log/nginx/error.log w,
 [2 - /var/log/nginx/*.log w,]
The filename error.log has been replaced by a wildcard and the extension .log. This rule would grant write permissions to the file /var/log/nginx/error.log as well as, for example, to the file /var/log/nginx/access.log – these are (at least) two rules combined into a single one.
These rules would already be sufficient for this example, but it might also be necessary to allow files that do not have the .log file extension to be written in the /var/log directory. By entering G, another suggestion is added to the list:
  1 - /var/log/nginx/error.log w,
 2 - /var/log/nginx/*.log w,
 [3 - /var/log/nginx/* w,]
The filename has now been replaced by a single wildcard, meaning the process would be allowed to open any files in /var/log/nginx with write permissions.
As already mentioned, the proposed rules only grant write permissions, but no read permissions, even if the file’s access rights would allow more. However, for a web server’s log file, write permissions are entirely sufficient.
Subsequently, nginx requests read access to various configuration files, for example /etc/nginx/nginx.conf. This file is located in the nginx web server’s configuration directory, which contains other files that should also be readable.
Profile: /usr/sbin/nginx
Path: /etc/nginx/nginx.conf
New Mode: owner r
Severity: unknown

 [1 - owner /etc/nginx/nginx.conf r,]
Here too, with G, the rule can be extended to all files in the /etc/nginx directory.
 1 - owner /etc/nginx/nginx.conf r,
 [2 - owner /etc/nginx/* r,]
The same applies to the subdirectories of the configuration directory; these can be covered by globbing as /etc/nginx/*/.
A special case for globbing is the files contained in those subdirectories:
Profile: /usr/sbin/nginx
Path: /etc/nginx/sites-available/default
New Mode: owner r
Severity: unknown

 [1 - owner /etc/nginx/sites-available/default r,]
After entering G twice, the wildcard ** is suggested after the wildcard * known from above, which, as described in the previous article, covers all files located in subdirectories (and their subdirectories).
 1 - owner /etc/nginx/sites-available/default r,
 2 - owner /etc/nginx/sites-available/* r,
 [3 - owner /etc/nginx/** r,]
The last steps also all contained the attribute owner: this ensures that a rule only applies if the accessing process is also the owner of the file. If the file exists but belongs to someone else, access is denied.
There are still some other paths and files such as /usr/share/nginx/modules-available/, /run/nginx.pid, and /proc/sys/kernel/random/boot_id, which nginx also requires for proper operation. However, the procedure remains unchanged.
Once all events have been processed, the program concludes with the message:
= Changed Local Profiles =

The following local profiles were changed. Would you like to save them?

 [1 - /usr/sbin/nginx]
(S)ave Changes / Save Selec(t)ed Profile / [(V)iew Changes] / View Changes b/w (C)lean profiles / Abo(r)t
The options are clear: S saves changes, while V allows them to be viewed as a Diff beforehand. The following listing shows the profile generated in the run above.
include <tunables/global>

profile nginx /usr/sbin/nginx {
 include <abstractions/base>
 include <abstractions/nameservice>

 capability dac_override,
 capability dac_read_search,
 capability setgid,
 capability setuid,

 /usr/sbin/nginx mr,

 /var/log/nginx/*.log w,

 /var/www/html/** r,

 owner /etc/nginx/* r,
 owner /etc/nginx/** r,

 owner /run/nginx.pid rw,

 owner /usr/share/GeoIP/*.mmdb r,
 owner /usr/share/nginx/modules-available/*.conf r,

 owner /var/cache/nginx/** rw,
 owner /var/lib/nginx/** rw,
}
After saving the changes, aa-genprof returns to its start screen. Here, one could search for events in log files again or exit the program with F.
The program ends with the message:
Setting /usr/sbin/nginx to enforce mode.

Reloaded AppArmor profiles in enforce mode.
The profile just created has therefore been loaded and put into enforce mode. This means that the program can only access what is allowed in the profile; all other access attempts are blocked by AppArmor and recorded in the Syslog.
For simple programs, the creation of a profile is thus complete, and AppArmor can perform its work; more complex programs, however, will show previously unknown behavior later on, which would be prevented by the profile created so far. In such cases, it helps to switch the profile to complain mode using aa-complain.
# aa-complain nginx
Accesses that go beyond the known profile are generally allowed in complain mode but are recorded in the Syslog.
Feb 18 15:25:50 web01 kernel: [ 9908.611408] audit: type=1400 audit(1645197950.338:100): apparmor="ALLOWED" operation="open" profile="nginx" name="/srv/www/index.html" pid=4490 comm="nginx" requested_mask="r" denied_mask="r" fsuid=33 ouid=0
In the excerpt from the Syslog above, the webroot directory on host web01 was changed to /srv/www, but the previously created AppArmor profile was not adjusted. Since the profile is now in complain mode, access was still allowed: apparmor="ALLOWED"; in enforce mode, it would say DENIED and access would be denied.
The remaining information clearly shows what happened: the process with process ID (pid) 4190 tried to open the file /srv/www/index.html (name) for reading (requested_mask), which would, however, be forbidden (denied_mask) due to the profile (profile) nginx.
So, if software secured with AppArmor doesn’t work as expected, the first place to look is the Syslog!
After some time, there will be several entries there that should then be incorporated into the AppArmor profile. For this, the program aa-logprof is used: it searches the Syslog for entries and, in the manner of aa-genprof, asks if and how entries should be created in the profile. This process can be repeated as often as necessary.
If no further entries are found in the Syslog, the profile has been sufficiently adjusted and can be switched back to enforce mode with aa-enforce:
# aa-enforce nginx
This completes the basic creation of a simple AppArmor profile, and the nginx processes are controlled and monitored according to the rules defined within it.
We are Happy to Support You
Whether AppArmor, Debian, or PostgreSQL: with over 22+ years of development and service experience in the open-source sector, credativ GmbH can professionally support you with unparalleled and individually configurable support and assist you fully with all questions regarding your open-source infrastructure.
Do you have questions about our article or would you like credativ’s specialists to look at another software of your choice?
Then visit us and contact us via our contact form or write us an email at info@credativ.de.
About Credativ
credativ GmbH is a vendor-independent consulting and service company based in Mönchengladbach.
Fundamentally, access control under Linux is a simple matter:
Files specify their access rights (execute, write, read) separately for their owner, their group, and finally, other users. Every process (whether a user’s shell or a system service) running on the system operates under a user ID and group ID, which are used for access control.
A web server running with the permissions of user www-data and group www-data can thus be granted access to its configuration file in the directory /etc, its log file under /log, and the files to be delivered under /var/www. The web server should not require more access rights for its operation.
Nevertheless, whether due to misconfiguration or a security vulnerability, it could also access and deliver files belonging to other users and groups, as long as these are readable by everyone, as is technically the case, for example, with /etc/passwd. Unfortunately, this cannot be prevented with traditional Discretionary Access Control (DAC), as used in Linux and other Unix-like systems.
However, since December 2003, the Linux kernel has offered a framework with the Linux Security Modules (LSM), which allows for the implementation of Mandatory Access Control (MAC), where rules can precisely specify which resources a process may access. AppArmor implements such a MAC and has been included in the Linux kernel since 2010. While it was originally only used in SuSE and later Ubuntu, it has also been enabled by default in Debian since Buster (2019).
AppArmor
AppArmor checks and monitors, based on a profile, which permissions a program or script has on a system. A profile typically contains the rule set for a single program. For example, it defines how (read, write) files and directories may be accessed, whether a network socket may be created, or whether and to what extent other applications may be executed. All other actions not defined in the profile are denied.
Profile Structure
The following listing (line numbers are not part of the file and serve only for orientation) shows the profile for a simple web server, whose program file is located under /usr/sbin/httpd is located.
By default, AppArmor profiles are located in the directory /etc/apparmor.d and are conventionally named after the path of the program file. The first slash is omitted, and all subsequent slashes are replaced by dots. The web server’s profile is therefore located in the file /etc/apparmor.d/usr.sbin.httpd.
 1 include <tunables/global>
  2
 3 @{WEBROOT}=/var/www/html
  4
 5 profile httpd /usr/sbin/httpd {
 6 include <abstractions/base>
 7 include <abstractions/nameservice>
  8
 9 capability dac_override,
10 capability dac_read_search,
11 capability setgid,
12 capability setuid,
13
14 /usr/sbin/httpd mr,
15
16 /etc/httpd/httpd.conf r,
17 /run/httpd.pid rw,
18
19 @{WEBROOT}/** r,
20
21 /var/log/httpd/*.log w,
22 }
Preamble
The instruction include in line 1 inserts the content of other files in place, similar to the C preprocessor directive of the same name. If the filename is enclosed in angle brackets, as here, the specified path refers to the folder /etc/apparmor.d; with quotation marks, the path is relative to the profile file.
Occasionally, though now outdated, the notation #include can still be found. However, since comments in AppArmor profiles begin with a # and the rest of the line is ignored, the old notation leads to a contradiction: a supposedly commented-out #include instruction would indeed be executed! Therefore, to comment out a include instruction, a space after the # is recommended.
The files in the subfolder tunables typically contain variable and alias definitions that are used by multiple profiles and are defined in only one place, according to the Don’t Repeat Yourself principle (DRY).
In line 2, the variable @{WEBROOT} is created with WEBROOT and assigned the value /var/www/html. If other profiles, in addition to the current one, were to define rules for the webroot directory, it could instead be defined in its own file tunables and included in the respective profiles.
Profile Section
The profile section begins in line 5 with the keyword profile. It is followed by the profile name, here httpd, the path to the executable file, /usr/sbin/httpd, and optionally flags that influence the profile’s behavior. The individual rules of the profile then follow, enclosed in curly braces.
As before, in lines 6 and 7, include also inserts the content of the specified file in place. In the subfolder abstractions, according to the DRY principle, there are files with rule sets that appear repeatedly in the same form, as they cover both fundamental and specific functionalities.
For example, in the file base, access to various file systems such as /dev, /proc, and /sys, as well as to runtime libraries or some system-wide configuration files, is regulated. The file
Starting with line 9, rules with the keyword capability grant a program special privileges, known as capabilities. Among these, setuid and setgid are certainly among the more well-known: they allow the program to change its own uid and gid; for example, a web server can start as root, open the privileged port 80, and then drop its root privileges. dac_override and dac_read_search allow bypassing the checking of read, write, and execute permissions. Without this capability, even a program running under uid root would not be able to access files regardless of their attributes, unlike what one is used to from the shell.
From line 14 onwards, there are rules that determine access permissions for paths (i.e., folders and files). The structure is quite simple: first, the path is specified, followed by a space and the abbreviations for the granted permissions.
Aside: Permissions
The following table provides a brief overview of the most common permissions:
| Abbreviation | Meaning | Description |
|---|---|---|
r | read | read access |
w | write | write access |
a | append | appending data |
x | execute | execute |
m | memory map executable | mapping and executing the file’s content in memory |
k | lock | setting a lock |
l | link | creating a link |
Aside: Globbing
Paths can either be fully written out individually or multiple paths can be combined into one path using wildcards. This process, called globbing, is also used by most shells today, so this notation should not cause any difficulties.
| Expression | Description |
|---|---|
/dir/file | refers to exactly one file |
/dir/* | includes all files within /dir/ |
/dir/** | includes all files within /dir/, including subdirectories |
? | represents exactly one character |
{} | Curly braces allow for alternations |
[] | Square brackets can be used for character classes |
Examples:
| Expression | Description |
|---|---|
/dir/??? | thus refers to all files in /dir whose filename is exactly 3 characters long |
/dir/*.{png,jpg} | refers to all image files in /dir whose file extension is png or jpg |
/dir/[abc]* | refers to all files in /dir whose name begins with the letters a, b, or c |
For access to the program file /usr/sbin/httpd, the web server receives the permissions mr in line 14. The abbreviation r stands for read and means that the content of the file may be read; m stands for memory map executable and allows the content of the file to be loaded into memory and executed.
Anyone who dares to look into the file
/etc/apparmor.d/abstractions/basewill see that the permissionmis also necessary for loading libraries, among other things.
During startup, the web server will attempt to read its configuration from the file /etc/httpd.conf. Since the path has r permission for reading, AppArmor will allow this. Subsequently, httpd writes its PID to the file /run/httpd.pid. The abbreviation w naturally stands for write and allows write operations on the path. (Lines 16, 17)
The web server is intended to deliver files below the WEBROOT directory. To avoid having to list all files and subdirectories individually, the wildcard ** can be used. The expression r.
As usual, all access to the web server is logged in the log files access.log and error.log in the directory /var/log/httpd/. These are only written by the web server, so it is sufficient to set only write permission for the path /var/log/httpd/* with w in line 21.
With this, the profile is complete and ready for use. In addition to those shown here, there are a variety of other rule types with which the allowed behavior of a process can be precisely defined.
Further information on profile structure can be found in the man page for apparmor.d and in the Wiki article on the AppArmor Quick Profile Language; a detailed description of all rules can be found in the AppArmor Core Policy Reference.
Creating a Profile
Some applications and packages already come with ready-made AppArmor profiles, while others still need to be adapted to specific circumstances. Still other packages do not come with any profiles at all – these must be created by the administrator themselves.
To create a new AppArmor profile for an application, a very basic profile is usually created first, and AppArmor is instructed to treat it in the so-called complain mode. Here, accesses that are not yet defined in the profile are recorded in the system’s log files.
Based on these log entries, the profile can then be refined after some time, and if no more entries appear in the logs, AppArmor can be instructed to switch the profile to enforce mode, enforce the rules listed therein, and block undefined accesses.
Even though it is easily possible to create and adapt an AppArmor profile manually in a text editor, the package apparmor-utils contains various helper programs that can facilitate the work: for example, aa-genprof helps create a new profile, aa-complain switches it to complain mode, aa-logprof helps search log files and add corresponding new rules to the profile, and aa-enforce finally switches the profile to enforce mode.
In the next article of this series, we will create our own profile for the web server nginx based on the foundations established here.
We are Happy to Support You
Whether AppArmor, Debian, or PostgreSQL: with over 22+ years of development and service experience in the open source sector, credativ GmbH can professionally support you with unparalleled and individually configurable support, fully assisting you with all questions regarding your open source infrastructure.
Do you have questions about our article or would you like credativ’s specialists to take a look at other software of your choice? Then feel free to visit us and contact us via our contact form or send us an email at info@credativ.de.
About Credativ
credativ GmbH is a vendor-independent consulting and service company based in Mönchengladbach. Since the successful merger with Instaclustr in 2021, credativ GmbH has been the European headquarters of the Instaclustr Group.
The Instaclustr Group helps companies realize their own large-scale applications thanks to managed platform solutions for open source technologies such as Apache Cassandra®, Apache Kafka®, Apache Spark™, Redis™, OpenSearch™, Apache ZooKeeper™, PostgreSQL®, and Cadence. Instaclustr combines a complete data infrastructure environment with practical expertise, support, and consulting to ensure continuous performance and optimization. By eliminating infrastructure complexity, companies are enabled to focus their internal development and operational resources on building innovative, customer-centric applications at lower costs. Instaclustr’s clients include some of the largest and most innovative Fortune 500 companies.
SQLreduce: Reduce verbose SQL queries to minimal examples

Developers often face very large SQL queries that raise some errors. SQLreduce is a tool to reduce that complexity to a minimal query.
SQLsmith generates random SQL queries
SQLsmith is a tool that generates random SQL queries and runs them against a PostgreSQL server (and other DBMS types). The idea is that by fuzz-testing the query parser and executor, corner-case bugs can be found that would otherwise go unnoticed in manual testing or with the fixed set of test cases in PostgreSQL’s regression test suite. It has proven to be an effective tool with over 100 bugs found in different areas in the PostgreSQL server and other products since 2015, including security bugs, ranging from executor bugs to segfaults in type and index method implementations. For example, in 2018, SQLsmith found that the following query triggered a segfault in PostgreSQL:
select
  case when pg_catalog.lastval() < pg_catalog.pg_stat_get_bgwriter_maxwritten_clean() then case when pg_catalog.circle_sub_pt(
          cast(cast(null as circle) as circle),
          cast((select location from public.emp limit 1 offset 13)
             as point)) ~ cast(nullif(case when cast(null as box) &> (select boxcol from public.brintest limit 1 offset 2)
                 then (select f1 from public.circle_tbl limit 1 offset 4)
               else (select f1 from public.circle_tbl limit 1 offset 4)
               end,
          case when (select pg_catalog.max(class) from public.f_star)
                 ~~ ref_0.c then cast(null as circle) else cast(null as circle) end
            ) as circle) then ref_0.a else ref_0.a end
       else case when pg_catalog.circle_sub_pt(
          cast(cast(null as circle) as circle),
          cast((select location from public.emp limit 1 offset 13)
             as point)) ~ cast(nullif(case when cast(null as box) &> (select boxcol from public.brintest limit 1 offset 2)
                 then (select f1 from public.circle_tbl limit 1 offset 4)
               else (select f1 from public.circle_tbl limit 1 offset 4)
               end,
          case when (select pg_catalog.max(class) from public.f_star)
                 ~~ ref_0.c then cast(null as circle) else cast(null as circle) end
            ) as circle) then ref_0.a else ref_0.a end
       end as c0,
  case when (select intervalcol from public.brintest limit 1 offset 1)
         >= cast(null as "interval") then case when ((select pg_catalog.max(roomno) from public.room)
             !~~ ref_0.c)
        and (cast(null as xid) <> 100) then ref_0.b else ref_0.b end
       else case when ((select pg_catalog.max(roomno) from public.room)
             !~~ ref_0.c)
        and (cast(null as xid) <> 100) then ref_0.b else ref_0.b end
       end as c1,
  ref_0.a as c2,
  (select a from public.idxpart1 limit 1 offset 5) as c3,
  ref_0.b as c4,
    pg_catalog.stddev(
      cast((select pg_catalog.sum(float4col) from public.brintest)
         as float4)) over (partition by ref_0.a,ref_0.b,ref_0.c order by ref_0.b) as c5,
  cast(nullif(ref_0.b, ref_0.a) as int4) as c6, ref_0.b as c7, ref_0.c as c8
from
  public.mlparted3 as ref_0
where true;
However, just like in this 40-line, 2.2kB example, the random queries generated by SQLsmith that trigger some error are most often very large and contain a lot of noise that does not contribute to the error. So far, manual inspection of the query and tedious editing was required to reduce the example to a minimal reproducer that developers can use to fix the problem.
Reduce complexity with SQLreduce
This issue is solved by SQLreduce. SQLreduce takes as input an arbitrary SQL query which is then run against a PostgreSQL server. Various simplification steps are applied, checking after each step that the simplified query still triggers the same error from PostgreSQL. The end result is a SQL query with minimal complexity.
SQLreduce is effective at reducing the queries from original error reports from SQLsmith to queries that match manually-reduced queries. For example, SQLreduce can effectively reduce the above monster query to just this:
SELECT pg_catalog.stddev(NULL) OVER () AS c5 FROM public.mlparted3 AS ref_0
Note that SQLreduce does not try to derive a query that is semantically identical to the original, or produces the same query result – the input is assumed to be faulty, and we are looking for the minimal query that produces the same error message from PostgreSQL when run against a database. If the input query happens to produce no error, the minimal query output by SQLreduce will just be SELECT.
How it works
We’ll use a simpler query to demonstrate how SQLreduce works and which steps are taken to remove noise from the input. The query is bogus and contains a bit of clutter that we want to remove:
$ psql -c 'select pg_database.reltuples / 1000 from pg_database, pg_class where 0 < pg_database.reltuples / 1000 order by 1 desc limit 10'
ERROR:  column pg_database.reltuples does not exist
Let’s pass the query to SQLreduce:
$ sqlreduce 'select pg_database.reltuples / 1000 from pg_database, pg_class where 0 < pg_database.reltuples / 1000 order by 1 desc limit 10'
SQLreduce starts by parsing the input using pglast and libpg_query which expose the original PostgreSQL parser as a library with Python bindings. The result is a parse tree that is the basis for the next steps. The parse tree looks like this:
selectStmt
├── targetList
│   └── /
│       ├── pg_database.reltuples
│       └── 1000
├── fromClause
│   ├── pg_database
│   └── pg_class
├── whereClause
│   └── <
│       ├── 0
│       └── /
│           ├── pg_database.reltuples
│           └── 1000
├── orderClause
│   └── 1
└── limitCount
    └── 10
Pglast also contains a query renderer that can render back the parse tree as SQL, shown as the regenerated query below. The input query is run against PostgreSQL to determine the result, in this case ERROR: column pg_database.reltuples does not exist.
Input query: select pg_database.reltuples / 1000 from pg_database, pg_class where 0 < pg_database.reltuples / 1000 order by 1 desc limit 10
Regenerated: SELECT pg_database.reltuples / 1000 FROM pg_database, pg_class WHERE 0 < ((pg_database.reltuples / 1000)) ORDER BY 1 DESC LIMIT 10
Query returns: ✔ ERROR:  column pg_database.reltuples does not exist
SQLreduce works by deriving new parse trees that are structurally simpler, generating SQL from that, and run these queries against the database. The first simplification steps work on the top level node, where SQLreduce tries to remove whole subtrees to quickly find a result. The first reduction tried is to remove LIMIT 10:
SELECT pg_database.reltuples / 1000 FROM pg_database, pg_class WHERE 0 < ((pg_database.reltuples / 1000)) ORDER BY 1 DESC ✔
The query result is still ERROR: column pg_database.reltuples does not exist, indicated by a ✔ check mark. Next, ORDER BY 1 is removed, again successfully:
SELECT pg_database.reltuples / 1000 FROM pg_database, pg_class WHERE 0 < ((pg_database.reltuples / 1000)) ✔
Now the entire target list is removed:
SELECT FROM pg_database, pg_class WHERE 0 < ((pg_database.reltuples / 1000)) ✔
This shorter query is still equivalent to the original regarding the error message returned when it is run against the database. Now the first unsuccessful reduction step is tried, removing the entire FROM clause:
SELECT WHERE 0 < ((pg_database.reltuples / 1000)) ✘ ERROR: missing FROM-clause entry for table "pg_database"
That query is also faulty, but triggers a different error message, so the previous parse tree is kept for the next steps. Again a whole subtree is removed, now the WHERE clause:
SELECT FROM pg_database, pg_class ✘ no error
We have now reduced the input query so much that it doesn’t error out any more. The previous parse tree is still kept which now looks like this:
selectStmt
├── fromClause
│   ├── pg_database
│   └── pg_class
└── whereClause
    └── <
        ├── 0
        └── /
            ├── pg_database.reltuples
            └── 1000
Now SQLreduce starts digging into the tree. There are several entries in the FROM clause, so it tries to shorten the list. First, pg_database is removed, but that doesn’t work, so pg_class is removed:
SELECT FROM pg_class WHERE 0 < ((pg_database.reltuples / 1000)) ✘ ERROR:  missing FROM-clause entry for table "pg_database"
SELECT FROM pg_database WHERE 0 < ((pg_database.reltuples / 1000)) ✔
Since we have found a new minimal query, recursion restarts at top-level with another try to remove the WHERE clause. Since that doesn’t work, it tries to replace the expression with NULL, but that doesn’t work either.
SELECT FROM pg_database ✘ no error
SELECT FROM pg_database WHERE NULL ✘ no error
Now a new kind of step is tried: expression pull-up. We descend into WHERE clause, where we replace A < B first by A and then by B.
SELECT FROM pg_database WHERE 0 ✘ ERROR:  argument of WHERE must be type boolean, not type integer
SELECT FROM pg_database WHERE pg_database.reltuples / 1000 ✔
SELECT WHERE pg_database.reltuples / 1000 ✘ ERROR:  missing FROM-clause entry for table "pg_database"
The first try did not work, but the second one did. Since we simplified the query, we restart at top-level to check if the FROM clause can be removed, but it is still required.
From A / B, we can again pull up A:
SELECT FROM pg_database WHERE pg_database.reltuples ✔
SELECT WHERE pg_database.reltuples ✘ ERROR:  missing FROM-clause entry for table "pg_database"
SQLreduce has found the minimal query that still raises ERROR: column pg_database.reltuples does not exist with this parse tree:
selectStmt
├── fromClause
│   └── pg_database
└── whereClause
    └── pg_database.reltuples
At the end of the run, the query is printed along with some statistics:
Minimal query yielding the same error:
SELECT FROM pg_database WHERE pg_database.reltuples

Pretty-printed minimal query:
SELECT
FROM pg_database
WHERE pg_database.reltuples

Seen: 15 items, 915 Bytes
Iterations: 19
Runtime: 0.107 s, 139.7 q/s
This minimal query can now be inspected to fix the bug in PostgreSQL or in the application.
About credativ
The credativ GmbH is a manufacturer-independent consulting and service company located in Moenchengladbach, Germany. With over 22+ years of development and service experience in the open source space, credativ GmbH can assist you with unparalleled and individually customizable support. We are here to help and assist you in all your open source infrastructure needs.
This article was initially written by Christoph Berg.
In the preceding article, Two-Factor Authentication with Yubico OTP, we demonstrated how quickly existing services can be extended with two-factor authentication (2FA) using Yubico OTP with the help of the PAM module pam_yubico. The validation service used, the YubiCloud, is provided by Yubico free of charge.
However, the fact that you are bound to an external service provider is not to everyone’s liking: data protection concerns or doubts about the reliability of the cloud service lead to the question of whether the required services could not also be operated on your own systems. There may also be scenarios in which you cannot access external services.
The good news is that there is also the option of hosting the services yourself!
Components

To be able to validate Yubico OTPs on your own system, two components are required: the YubiKey OTP Validation Server and the YubiKey Key Storage Module. Yubico provides the necessary software both in source code and as ready-made binary packages in various Linux distributions.
It should be noted that a large part of the documentation available online is still based on the old Key Storage Module, YK-KSM. The YK-KSM is implemented in PHP5 and is to be regarded as obsolete because it requires functions and libraries that are no longer included or available in current PHP versions.
Validation Server – VAL
The Validation Server implements the Yubico WSAPI for validating Yubico OTPs, which is also used in the YubiCloud. This is a PHP application that requires an RDBMS such as PostgreSQL® or MySQL in addition to the Apache web server to operate.
The PAM module pam_yubico discussed in the previous articles can be configured by specifying a URL so that it uses a different Validation Server, in our case a local one, instead of the YubiCloud.
If a client, for example the PAM module, sends a Yubico OTP to the validation service via the WSAP, the validation service forwards the OTP to the Key Storage Module and receives the decrypted OTP back from there. Based on the counter readings and timestamps, which are compared with the last values stored in the database, the VAL can then decide whether the OTP is valid or not.
Key Storage Module – KSM
The Key Storage Module is used for the secure storage of the shared secrets of the YubiKeys used. The key used for encryption is either stored on a hardware module costing a good €650, or – as in this case – inexpensively in a text file. In contrast to the VAL, the KSM does not require a relational database, but instead uses the file system, by default the folder /var/cache/yubikey-ksm, and stores the shared secrets there in encrypted form in so-called AEAD files.
The KSM used here is implemented in Python and runs as an independent service, which by default listens on port 8002 TCP for connections from localhost and offers a simple REST interface there.
The Validation Server can use this REST interface to send OTPs to be checked to the Key Storage Module, which then uses the Public ID to read the corresponding shared secret from its memory in order to decrypt the OTP and return its content to the VAL.
Installation
Fortunately, there are ready-made packages for both the validation server and the key storage module in most Linux distributions. The following describes the installation and configuration of the services under Debian GNU/Linux Buster.
Key Storage Module – KSM
The KSM can be easily installed in Debian with the package yhsm−yubikey−ksm installed:
# apt-get install yhsm−yubikey−ksm
Before configuring the newly installed service, the so-called keyfile, which contains the key used to encrypt the key storage, must be created:
# mkdir -p /etc/yubico/yhsm
# touch /etc/yubico/yhsm/keys.json
# chown yhsm−ksmsrv /etc/yubico/yhsm/keys.json
# chmod 400 /etc/yubico/yhsm/keys.json
The keyfile can now be opened with any editor and filled with a key. As the file extension suggests, the keyfile is a JSON file. In the following example, the key, which is located in “Slot” 1, is 000102030405060708090a0b0c0d0e0f101112131415161718191a1b1c1d1e1f.
{
  "1": "000102030405060708090a0b0c0d0e0f101112131415161718191a1b1c1d1e1f"
}
000102030405060708090a0b0c0d0e0f101112131415161718191a1b1c1d1e1f is the hexadecimal representation of a 32-byte (i.e. 256-bit) example key. For productive use, a reasonable key created from random data should of course be used. The program openssl can be used for this:
$ openssl rand -hex 32
To configure the KSM, only a few parameters need to be adjusted in the file /etc/default/yhsm−yubikey−ksm:
YHSM_KSM_ENABLE="true"
YHSM_KSM_DEVICE="/etc/yubico/yhsm/keys.json"
YHSM_KSM_KEYHANDLES="1"
The parameter YHSM_KSM_ENABLE="true" ensures that the KSM is started automatically when the system starts. Instead of the hardware device configured by default, the keyfile just created and the key with the ID 1 from it are used.
Finally, the KSM is restarted with the changed configuration using systemctl restart yhsm−yubikey−ksm.
Validation Server – VAL
As already mentioned, the Validation Server is a web application written in PHP, the operation of which requires a web server and an RDBMS. While the package dependencies prescribe an Apache web server, you have the choice between MySQL, MariaDB and PostgreSQL® for the databases. According to the dependency order of the package, MySQL would be installed by apt here, but to give PostgreSQL® preference, it must be explicitly listed:
# apt-get install yubikey−val postgresql php−pgsql
The configuration of the Validation Server in /etc/yubico/val/ is set by default to the Key Storage Module running locally on the same system, so no further intervention is necessary.
So that the PAM module can authenticate itself later when making requests to the Validation Server, credentials in the form of an ID and a key must still be created:
# ykval−gen−clients
2,cOyFHRvltNYDjx74JE9jOBcdPhI=
This step corresponds to the registration in the YubiCloud described in the previous article. The output of the command consists of two parts: the ID, followed by a comma and the key in Base64 encoding.
If the Validation Service is to be used from several machines, it is recommended to create separate credentials for each machine. To have several ID-key pairs created, ykval-gen-clients is simply called with the desired number:
# ykval−gen−clients 5
3,6WP1q1ohy92G/BNLMNjpHpVeL1Q=
4,InVj6Nbqc9FQN1EgtbsedtuYT9I=
5,p/R/hHx6E3Kf3Qc+671O46laNec=
6,/FRX6YqioHSap+zoM+LkWp88TFU=
7,XxEp4zoHSi9zTDSngvxnGiD4V1A=
To avoid losing track, you should note which credentials were used for which computer. Alternatively, ykval-gen-clients with the switch --notes allows you to create a note:
# ykval-gen-clients --notes=OpenVPN
8,rZKpqc5WcU4OB4Nv551+U3lj2tk=
The program ykval-export-clients outputs all credentials stored in the database, including notes, to the standard output:
# ykval-export-clients
1,1,1619686861,ua//VH5rvFoxrFHGhLZBz/RO3m0=,,,
…
8,1,1619687606,pkodRX1F77Ck7bvS9MzpXE5IfxA=,,OpenVPN,
Here you can see that credentials with ID 1 were already created during the installation of the package. Of course, instead of creating your own ID, you can also read this from the database and use it to set up the PAM module.
PAM
As the last change to the system, the PAM module pam_yubico must be installed and entered in the corresponding service configuration.
# apt-get install libpam−yubico
As in the previous articles, OpenVPN should once again benefit from 2FA with Yubico OTP. For this purpose, the file /etc/pam.d/openvpn is created or adapted:
auth sufficient pam_yubico.so id=2 key=cOyFHRvltNYDjx74JE9jOBcdPhI= urllist=http://localhost/wsapi/2.0/verify authfile=/etc/yubikey_mappings
account required pam_permit.so
The values specified in the above call of ykval-gen-clients or ykval-export-clients are used as values for id and key. The parameter urllist receives the URL of the WSAPI of the validation service, which in this case runs on the same computer.
As with the use of the YubiCloud, a authfile must be specified again this time – a file that contains the mappings of user names to Public IDs. This is created later, after the keys have been generated.
The configuration of the OpenVPN service is carried out as described in the article Two-Factor Authentication for OpenSSH and OpenVPN. On the server side, the supplied OpenVPN-PAM plugin must be loaded in the configuration:
plugin /usr/lib/openvpn/openvpn-plugin-auth-pam.so openvpn
On the client side, only the option auth-user-pass is added to the existing configuration, so that the user is asked for a user name and password (here: OTP) when establishing a connection.
Key Management
So that YubiKeys can be used with your own validation service, they must be programmed with a new key, the shared secret. These keys are created in the KSM, read out from it and then written to the YubiKey.
As the shared secret programmed on the YubiKey at the factory cannot be read out, it is of no use for a self-hosted validation service.
Generation in the KSM
To generate a series of keys in the Key Storage Module, the command yhsm-generate-keys is used:
# yhsm-generate-keys -D /etc/yubico/yhsm/keys.json --key-handle 1 --start-public-id credtivccccc -c 10
output dir : /var/cache/yubikey-ksm/aeads
keys to generate : 10
key handles : {1: '1'}
start public_id : 13412510728192 (0xc32d7f00000)
YHSM device : /etc/yubico/yhsm/keys.json

Generating 10 keys

Done
The above command creates 10 (-c) keys, starting with the ID credtivccccc (--start-public-id) and uses the key with the ID 1 (--key-handle), which is in the file /etc/yubico/yhsm/keys.json (-D) for encryption. The keys are stored as described above under /var/cache/yubikey-ksm/aeads.
The output gives a brief overview of the parameters used, the simple Done indicates the successful creation and storage of the credentials.
Caution: if the above command is called several times, existing keys with the same ID will be overwritten without prompting!
With the help of the command yhsm-decrypt-aead, the keys just created can now be read out from the KSM:
# yhsm-decrypt-aead --aes-key 000102030405060708090a0b0c0d0e0f101112131415161718191a1b1c1d1e1f --format yubikey-csv /var/cache/yubikey-ksm/aeads/
1,credtivccccf,47072c411963,1feff43b2d2b529c697d9db0849c9594,000000000000,,,,,
2,credtivccccc,512a73c09e98,d6e07a6def46cee722be21b7c2f35aec,000000000000,,,,,
3,credtivcccce,b491988426de,a72669341ab2a7d2acecec91c2fa0efb,000000000000,,,,,
4,credtivcccci,fccc5e1dcfcf,b0b14a2454c6d2a54bd2351f09d19d6e,000000000000,,,,,
5,credtivccccb,8a0b3916582f,a031f201920f6204a38b239836486bbf,000000000000,,,,,
6,credtivccccj,b9dd85895291,e04d79d45ff80438c744f2a8deec4a15,000000000000,,,,,
7,credtivccccg,a5213cab8e9c,f20acb5646de4282f21ef12b65c6a082,000000000000,,,,,
8,credtivcccch,73e9c1fa06b9,4c9d121e432a2fbd14b4a5d96f3b9d8f,000000000000,,,,,
9,credtivccccd,0695db026eb8,90779c79b363b7dbe54a9c3012e688e5,000000000000,,,,,
10,credtivcccck,ddd42451acb3,f5803057ea519149041be830509b7b2a,000000000000,,,,,
The AES key created during the setup of the KSM is specified here as --aes-key; the argument --format yubikey-csv ensures that the credentials are output as comma-separated values instead of in raw format. The last argument specifies the storage location of the AEAD in the file system.
Programming the YubiKey
A line in the above output of the command yhsm-decrypt-aead contains the credentials for a YubiKey in several comma-separated fields: in addition to the serial number (field 1), these are the Public ID (field 2), the Private ID (field 3) and the actual AES key (field 4). All other fields are not used in our case.
The entry in line 1 therefore contains the Public ID credtivccccf with the Private UID 47072c411963 and the AES key 1feff43b2d2b529c697d9db0849c9594.
These credentials can now be written to a YubiKey. The program ykpersonalize is a powerful command line tool for configuring YubiKeys and is located in the package yubikey-personalization on Debian.
If there is already a configuration in slot 1 (-1) of the Yubikey that should not be overwritten, you can instead write to slot 2 using -2. The call ykpersonalize -x swaps the contents of slot 1 and slot 2 of a YubiKey.
Unfortunately, the tool ykpersonalize uses different terms for the components of a credential: the Public ID becomes the fixed part and the Private UID becomes the uid. The following call writes the above credentials to slot 1 of a plugged-in YubiKey.
$ ykpersonalize -1 -o fixed=credtivccccf -o uid=47072c411963 -a 1feff43b2d2b529c697d9db0849c9594
Firmware version 5.1.2 Touch level 1287 Program sequence 3

Configuration data to be written to key configuration 1:

fixed: m:credtivccccf
uid: 47072c411963
key: h:1feff43b2d2b529c697d9db0849c9594
acc_code: h:000000000000
ticket_flags: APPEND_CR
config_flags:
extended_flags:

Commit? (y/n) [n]:
It should be noted that fixed part and uid are transferred as a KV pair using -o, while the AES key is transferred directly using -a.
If the query Commit? is answered in the affirmative, the displayed configuration is written to the Yubikey and from then on, when the button is pressed, it outputs a Yubico OTP created with the new credentials.
If you want to program several YubiKeys, the next of the generated credentials is simply used in further calls of ykpersonalize accordingly. All commands and tools used use files in CSV format or use stdin/stdout; recurring processes can therefore be excellently automated by a bash script or similar.
As an alternative to the approach described here, the YubiKey Personalization Tool from the package yubikey-personalization-gui offers the possibility to program several YubiKeys in a row. To do this, activate the option Program Multiple YubiKeys in the GUI under Yubico OTP → Advanced. In order to store the credentials of the YubiKeys programmed in this way in the KSM, the log file configuration_log_hmac.csv offered for saving after programming must first be adapted before the credentials contained therein can be imported into the KSM with the program yhsm-import-keys.
According to the man page, yhsm-import-keys expects a CSV file with the following structure:
# ykksm 1
seqno, public id, private uid, AES key,,,,
…
The log file of the YubiKey Personalization Tool already contains the fields public id, private uid, and AES key in the correct order as fields 4-6. The following awk script log2ksm.awk extracts these fields from the file, sets their line number as a sequence number in front of them, and outputs the entries line by line after the mandatory header # ykksm 1:
#!/usr/bin/awk -f

BEGIN {
  FS=","
  printf("# ykksm 1\n")
}

/^Yubico OTP/ {
  printf("%d,%s,%s,%s,,,,
", NR, $4, $5, $6)
}
The command to convert the file configuration_log_hmac.csv and save the result as yubikey_secrets.csv is:
$ ./log2ksm.awk configuration_log_hmac.csv > yubikey_secrets.csv
The generated file can then be copied to the machine where the KSM is running, and its entries can be imported into it with the following command:
# yhsm-import-keys -D /etc/yubico/yhsm/keys.json --key-handle 1  <  yubikey_secrets.csv
output dir : /var/cache/yubikey-ksm/aeads
key handles : {1: '1'}
YHSM device : /etc/yubico/yhsm/keys.json


Done
Here too, Done indicates that the credentials have been successfully imported.
PAM
So that PAM can map received Public IDs to user accounts during authentication, the above configured authfile under /etc/yubikey_mappings must still be created. This contains a username and its assigned YubiKey IDs per line, separated by colons. If the newly created YubiKey with the Public ID credtivccccf is to be used by user bob, the authfile must contain the following line:
bob:credtivccccf
Mappings for further user accounts are configured accordingly in separate lines.
As an alternative to using a authfile, the mappings can also be made using an LDAP directory service. A separate article will be dedicated to this variant.
Demo
If all steps have been carried out successfully up to this point, the OpenVPN client will ask for a username and password or the OTP when establishing a connection. While the username still has to be entered manually, a press of a button on the YubiKey is sufficient to enter the OTP, so that the connection can be established. Instead of the individual characters of the OTP, only asterisks are displayed here as well.
# openvpn client.conf
...
Enter Auth Username: bob
Enter Auth Password: ********************************************
...
Conclusion
The installation and operation of your own validation service and Key Storage Module is quite complex and involves some effort. The interaction of the components with each other is difficult to track (which makes troubleshooting difficult), and the available tools are sometimes not very intuitive or even inconsistent (which makes understanding difficult).
However, those who do not shy away from the effort and are willing to delve deeper into the subject can ultimately enjoy the full comfort of Yubico OTP while still maintaining control over all components.
Support
If you require support with the configuration or use of two-factor authentication, our Open Source Support Center is at your disposal – if desired, also 24 hours a day, 365 days a year.
The article Two-factor authentication for OpenSSH and OpenVPN presented a simple way to increase the security of PAM-enabled services through two-factor authentication. The TOTP method used generates a one-time password that is valid for a limited period of time based on a shared secret.
Depending on the method and encoding, the shared secret consists of 32 or even 40 characters that must be communicated to the user. QR codes have become established as a convenient and fault-tolerant solution for this, which can be read with suitable apps. However, these QR codes often contain additional, superfluous information that allows conclusions to be drawn about the account.
This article takes a look at the structure of the content of such QR codes and how they can still be used securely.
Pitfalls
In his article Why you shouldn’t scan two-factor authentication QR codes, Sam Aiken constructs interesting scenarios and advises against the thoughtless use of QR codes for transmitting the shared secret in 2FA.
In addition to the shared secret, most QR codes also contain information about the service provider, the service itself, and usernames. If an attacker obtains this information – be it through the QR code itself or because the app used stores its data unsecured locally or in the cloud, or loses it otherwise – he only needs to obtain the account password to use the service under a false name.
The user is, of course, free to delete or modify this additional information, but according to Aiken, this is not possible in all apps: some apps did not allow changes, while others offered the possibility to make changes but remembered the originally read values, so that unnecessary information could be disclosed here as well. Aiken also criticizes that many services only displayed QR codes, but not the shared secret as a string, which would give the user full control over the data entered into an app.
In addition to using a recommended app in this regard, such as andOTP, whose use admins can influence but not always prescribe, it would therefore be desirable if QR codes contained only the essential information from the outset anyway.
URI Scheme
The content of such a QR code ultimately corresponds to a URI, such as the one Google uses for its Authenticator app at Github:
otpauth://TYPE/LABEL?PARAMETERS
The placeholder TYPE indicates whether the method used is HOTP or, as in our case, TOTP; LABEL, according to the specification, should contain information about the issuer and user account; PARAMETERS can contain additional information besides the required secret.
| Parameter | Description | Default |
|---|---|---|
| secret | Shared Secret in Base32 encoding | – |
| counter | Counter value for HOTP | – |
| issuer | Issuer | – |
| algorithm | Used Hash Algorithm | SHA1 |
| digits | Length of the generated OTP | 6 |
| period | Validity period for TOTP | 30 |
Of all the options listed, according to the specification for TOTP, only TYPE, LABEL, and the PARAMETER secret are required.
With this information, we can now create a URI for the shared secret generated for user Alice in the last article. For data economy, only the service is specified here in the label. Should Alice require further information about the service, it can be communicated to her through other means.
otpauth://totp/OpenVPN?secret=4LRW4HZQCC52QP7NIEMCIT4FXYOLWI75
The information contained in this URI does not allow any conclusions to be drawn about the operator, the address, or the username used for the specified service. This should be sufficiently secure for most use cases.
Furthermore, tests with andOTP showed that the LABEL section of a URI can also be left completely empty and still be read without problems:
otpauth://totp/?secret=4LRW4HZQCC52QP7NIEMCIT4FXYOLWI75

Generate QR Code
To convert the URI you just created into a QR code, you can use the command line tool qrencode. The codes can be written to an image file or displayed directly as ASCII art on the command line:
$ qrencode -t ANSI 'otpauth://totp/OpenVPN?secret=4LRW4HZQCC52QP7NIEMCIT4FXYOLWI75'
Strictly speaking, -t ANSI ANSI art is generated here by the argument, because so-called border characters are used in the output, which do not appear in the original ASCII character set. Although an output in true ASCII art can be generated using -t ASCII, the graphic consists only of # and spaces, which is much harder to recognize and thus unnecessarily complicates reading with a smartphone.
If an image file is to be generated instead, the output format is set to PNG with -t PNG and the name of the output file is specified using -o qr-alice.png:
$ qrencode -t PNG -o qr-alice.png -s 10 'otpauth://totp/OpenVPN?secret=4LRW4HZQCC52QP7NIEMCIT4FXYOLWI75'
The argument -s 10 is optional here and serves only to increase the size of a dot in the output file from three to ten pixels:

Edit Entry
Should Alice want to record further information about her OTP, she can now enter this herself manually in her app or record it otherwise. Here too, data economy does not have to be sacrificed: for example, to distinguish between two VPN entries, it is sufficient to assign them different Issuers, such as Work and Club. In the case of andOTP, this also changes the icon, which now uses the first letter of the issuer.
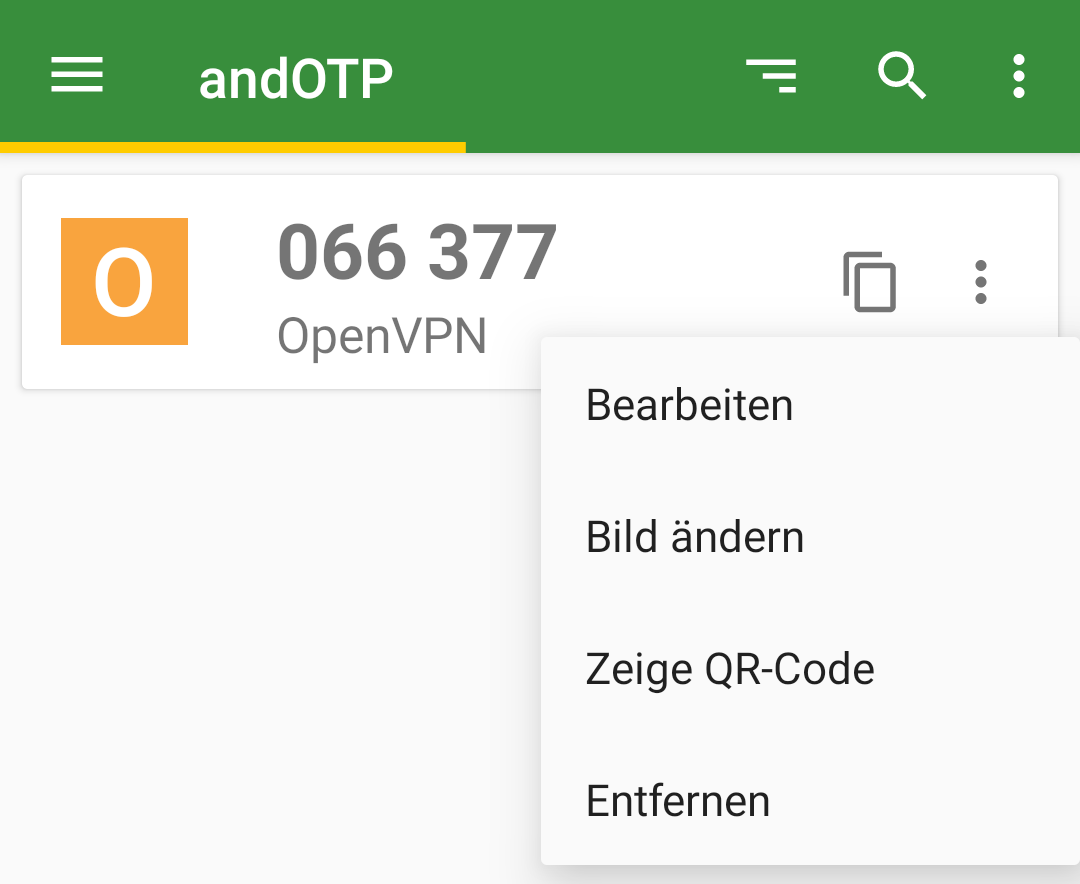
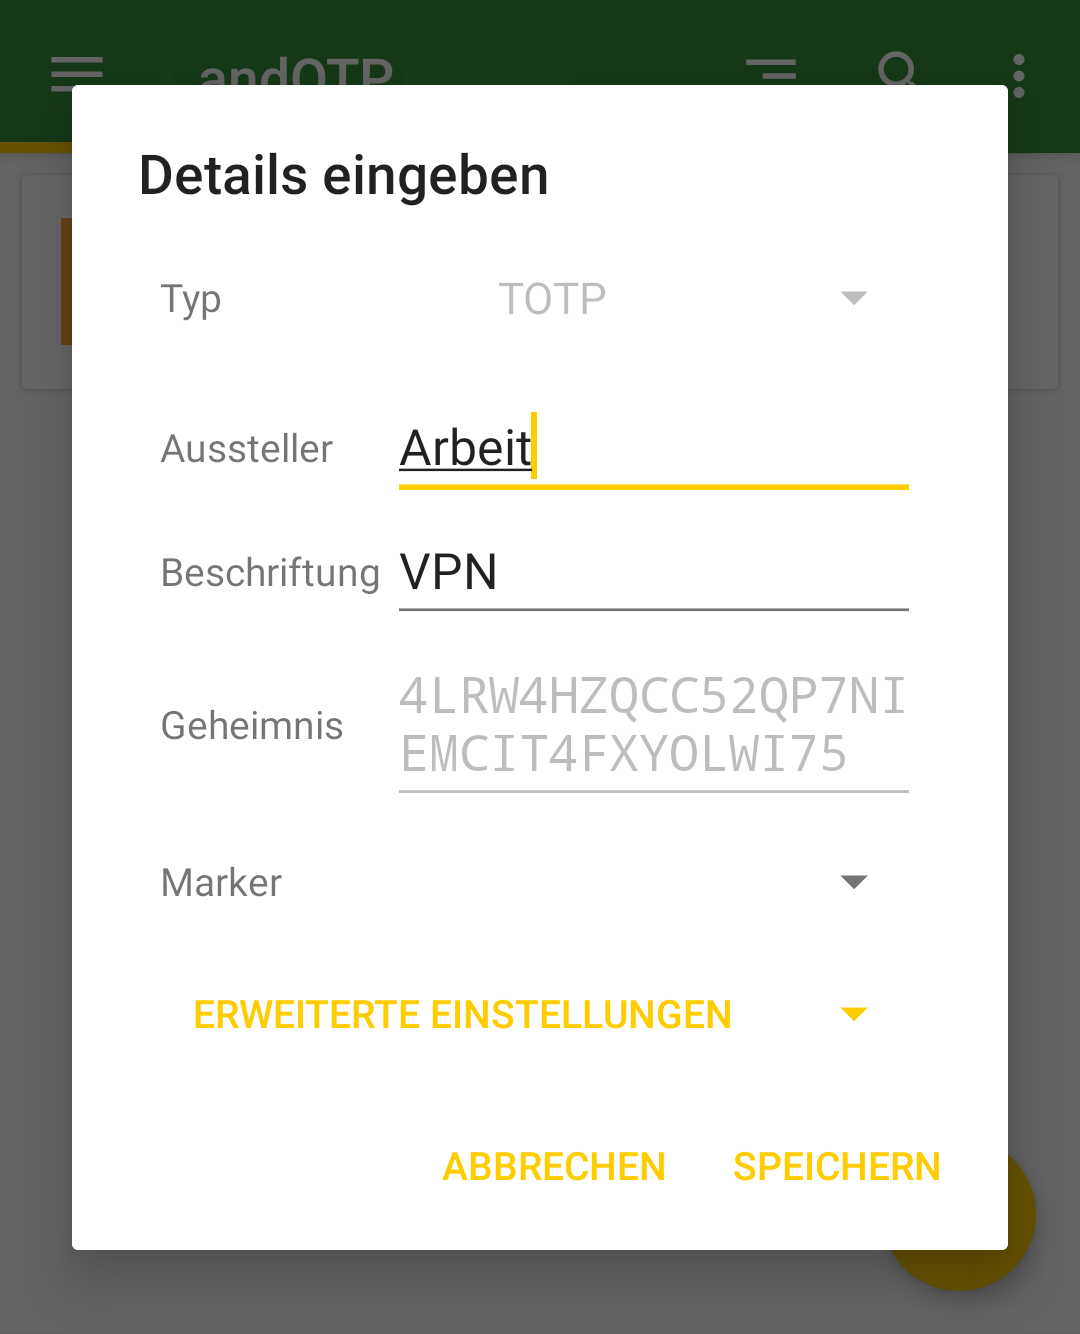

Conclusion
QR codes are still best suited for transmitting shared secrets to end-users. However, before blindly copying the practices of others, it is worthwhile to look behind the scenes of the standards used and to consider what information really needs to be transmitted and to practice data economy when creating your own QR codes.
By using a flexible command-line tool like qrencode, the creation of custom QR codes could even be automated quite easily for a larger number of users.
Support
If you require support with the configuration or use of two-factor authentication, our Open Source Support Center is at your disposal – if desired, also 24 hours a day, 365 days a year.
Authentication using username and password still represents the standard procedure for most applications to authenticate to a service. However, the use of a second factor is becoming increasingly widespread and is even recommended by the BSI, the German Federal Office for Information Security. While not mandatory, various web services at least offer the option to enable two-factor authentication (2FA) for a user account.
However, not only the security of web services can be enhanced using 2FA—classic services such as SSH also allow the use of a second factor alongside the usual authentication methods such as passwords or certificates.
Methods
The most widely used method for one-time passwords as a second factor is probably TOTP, the Time-Based One-Time Password. The method is standardized in RFC6238 and is sometimes also known as Google Authenticator.
With TOTP, a numeric one-time password (OTP) valid for a short period is calculated from the current time and the shared secret, a secret known to both the service and the user.
Typically—and fixed in the case of Google Authenticator—the password consists of 6 digits and has a validity period of 30 seconds. However, the standard also provides for other lengths and time periods.
For calculating the OTP, there are CLI applications such as oathtool as well as GUI applications such as KeePassXC or smartphone apps such as AndOTP.
Setup
PAM (Pluggable Authentication Modules) is a collection of libraries that allows applications and services to delegate user authentication instead of having to implement it themselves. For this purpose, the messages exchanged during authentication between PAM and the user are forwarded through the application to the respective recipient.
During this conversation, PAM processes the modules configured in the application’s service file, in which the respective authentication methods are implemented. PAM ultimately reports only success or failure of the authentication to the application itself.
To use one-time passwords under Linux, the PAM module pam_oath is recommended. All services that use PAM to authenticate their users can thus be easily extended with two-factor authentication functionality. These include not only system internals such as login, su, or sudo, but also network-accessible services such as SSH or OpenVPN.
Depending on the distribution used, the PAM module is located in the package libpam-oath (Debian etc.) or pam_oath (CentOS etc.) and can be installed from the official sources.
PAM
To set up TOTP for SSH, the corresponding PAM service file must be modified. This is located at /etc/pam.d/sshd.
This file is approximately 50 lines long and describes, among other things, how a user’s identity can be verified when logging in via SSH and what environment is created before calling their login shell.
The exact function of the individual entries would exceed the scope of this article. The only line of interest for setting up TOTP is
@include common-auth
This adopts the default system behavior defined in the service file /etc/pam.d/common-auth: using the module pam_unix, the user’s password is compared with that in /etc/shadow.
To require verification of an OTP using pam_oath, the following line is added directly below the above @include directive:
auth required pam_oath.so usersfile=/etc/users.oath digits=6 window=2
The parameter usersfile refers to a file in which the users’ shared secrets are stored, digits=6 sets the length of the OTP to 6 digits.
Using window=2 enlarges the window of allowed OTPs. With a window size of 2, in addition to the currently valid OTP, the passwords from the previous and next time period are also valid. While a window size of 0 only allows the current OTP, an increasing number allows one more future and one more past password respectively. Additional parameters can be found in the module’s documentation.
The structure of the usersfile follows the *NIX tradition: each line represents an entry containing multiple fields separated by one or more spaces. While an entry can contain up to nine fields, only the first four are relevant when setting up a new user. They contain, in order: the method used, the username, an optional PIN, and in the last field the shared secret.
The RFC recommends a 160-bit (i.e., 20-byte) random number as the shared secret. This can easily be created using the openssl program:
$ openssl rand -hex 20
The output is the 40-character Base16-encoded representation of the randomly generated string, for example e2e36e1f3010bba83fed4118244f85be1cbb23fd.
To append an entry for the user alice using the TOTP method with a validity period of 30 seconds to the usersfile, the following command line can be used. The call to openssl contained in $() is replaced by its output, the 20-byte shared secret.
$ echo "HOTP/T30 alice - $(openssl rand -hex 20)" | tee -a /etc/users.oath
The program tee outputs the generated entry including the shared secret on the command line and also appends it as an additional line to the usersfile /etc/users.oath:
$ echo "HOTP/T30 alice - $(openssl rand -hex 20)" | tee -a /etc/users.oath
HOTP/T30 alice - e2e36e1f3010bba83fed4118244f85be1cbb23fd
SSH
An OpenSSH configured with default settings authenticates users using the built-in PasswordAuthentication. To use PAM, this must be disabled and ChallengeResponseAuthentication enabled instead. Authentication via PAM is then activated using the parameter UsePAM.
The configuration file /etc/ssh/sshd_config must therefore contain the following lines:
PasswordAuthentication no
ChallengeResponseAuthentication yes
UsePAM yes
Demo
Due to the changes to the OpenSSH configuration, the prompt that requests password entry during connection establishment has changed.
The PasswordAuthentication built into OpenSSH displayed the username and hostname used for the connection in the prompt.
alice@local$ ssh alice@192.0.2.1
alice@192.0.2.1's password:
alice@remote$
After switching to PAM using ChallengeResponseAuthentication, the input prompt of the respective PAM module is displayed: first pam_unix, then pam_oath.
alice@local$ ssh alice@192.0.2.1
Password:
One-time password (OATH) for `alice':
alice@remote$
OpenVPN
OpenVPN classically authenticates users via certificates validated by a trusted, often local, CA. However, during the connection establishment process, it is also possible to query a username and associated password on the client side and verify them on the server side.
To add 2FA to an existing OpenVPN installation, only a few changes to the configuration files are required.
To enable OpenVPN to delegate authentication of the username and password to PAM, the PAM plugin included in the standard installation is entered in the server’s OpenVPN configuration:
plugin /usr/lib/openvpn/openvpn-plugin-auth-pam.so openvpn
The parameter openvpn corresponds to the name of the PAM service file in /etc/pam.d/, which must be newly created:
auth required pam_oath.so usersfile=/etc/users.oath digits=6 window=2
@include common-account
If there are no user accounts on the machine running the OpenVPN service, their existence check can be skipped with a modified service file:
auth required pam_oath.so usersfile=/etc/users.oath digits=6 window=2
account required pam_permit.so
The module pam_permit always returns success. Since it is the only specified module of type auth, only its result is evaluated.
On the client side, only the following line needs to be added to the configuration so that the user is prompted for their username and (one-time) password during connection establishment:
auth-user-pass
If the connection is configured on the client side via a GUI such as NetworkManager, under Connection type, instead of the usual setting Certificates (TLS), the entry Password with certificates (TLS) must be selected. Under Username, the username to be used is entered, but the Password field remains empty; the option Ask for this password every time must be selected there.
Demo
After adjusting the configuration on the client, the user is prompted to enter a username and the associated OTP during the TLS negotiation of the connection establishment, immediately after certificate verification.
# openvpn client.conf
...
Enter Auth Username: alice
Enter Auth Password: ******
...
Even when using NetworkManager, the user is prompted for the current one-time password during connection establishment.
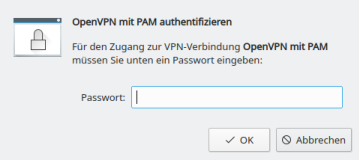
Calculate OTP
The shared secret, or shared secret, must—as the name suggests—be known to both sides. On the server side, it is located in the usersfile; on the client side, there are various ways for the user to store the shared secret in order to calculate an OTP.
The shared secret required for calculation was generated with the openssl call listed above and output in hexadecimal representation or Base16-encoded. In addition to Base16, representation in Base32 is also common, so care must be taken as to which encoding a program expects when entering the shared secret. Both mentioned methods are described and standardized in RFC 4648.
While the tools base32 and base64 for Base32 and Base64 respectively are already included in the package coreutils, another tool must be installed for converting from Base16, for example basez. In addition to the main application basez, several symbolic links to it are also created, including base16, which can be used like base32 and base64.
To convert the shared secret generated above for alice from Base16 to Base32, the following call is sufficient. The option -d when calling base16 stands for decode, since the conversion is from Base16.
$ echo e2e36e1f3010bba83fed4118244f85be1cbb23fd | base16 -d | base32
4LRW4HZQCC52QP7NIEMCIT4FXYOLWI75
In Base32 encoding, the shared secret is 4LRW4HZQCC52QP7NIEMCIT4FXYOLWI75.
As expected, there are also numerous web-based tools online for converting between the various encodings. However, transmission to websites is not recommended: even a shared secret is a secret and should not be disclosed to third parties!
The situation is similar when using QR codes, which will be covered in a separate article. Although widely used, their use is not without risks that should be analyzed and minimized beforehand.
CLI
The program oathtool enables the calculation of OTP on the command line. To calculate TOTP, it is passed the argument --totp and the shared secret in Base16 encoding when called:
$ oathtool --totp e2e36e1f3010bba83fed4118244f85be1cbb23fd
oathtool assumes an OTP length of 6 digits and a window of 0. These assumptions can be adjusted with the arguments -d (Digits) and -w (Window).
If the shared secret is Base32-encoded, the argument -b must be prepended:
$ oathtool --totp -b 4LRW4HZQCC52QP7NIEMCIT4FXYOLWI75
GUI
In addition to securely storing static passwords, KeepassXC also offers the ability to generate one-time passwords according to TOTP. For this purpose, the shared secret is stored as an attribute of an entry.
The shared secret can be added to an existing entry as a key by right-clicking and selecting Time-based One-Time Password (TOTP) > Set up TOTP…. RFC 6238 token standard settings assumes a length of 6 digits and a validity of 30 seconds. The Base16-encoded shared secret is expected as the key.
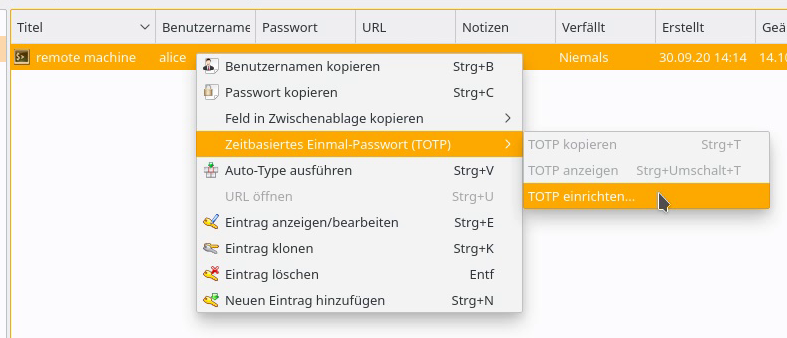
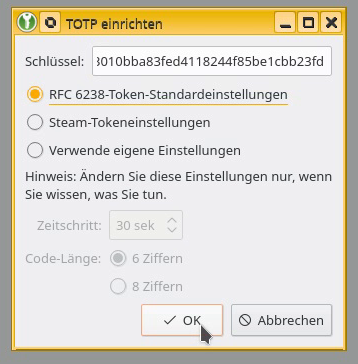
By right-clicking on the entry, the current one-time password can be displayed via Time-based One-Time Password (TOTP) > Show TOTP, or copied to the clipboard via Copy TOTP.
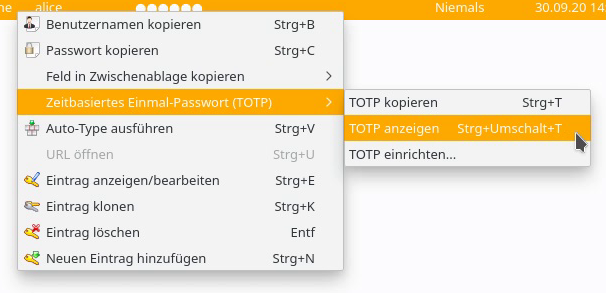
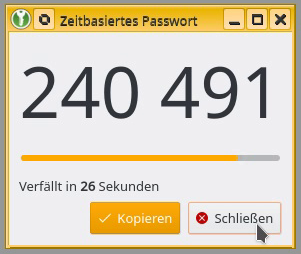
Smartphone App
To calculate a TOTP on a smartphone, andOTP is recommended. The app is free software, licensed under the MIT License, and can be easily installed via F-Droid or from the Google Play Store.
A new entry can be created via the plus button in the lower right corner of the screen. In addition to the option to scan a QR code, the shared secret can be entered manually via the menu item Enter details, along with some settings such as time period, length, or hash algorithm.
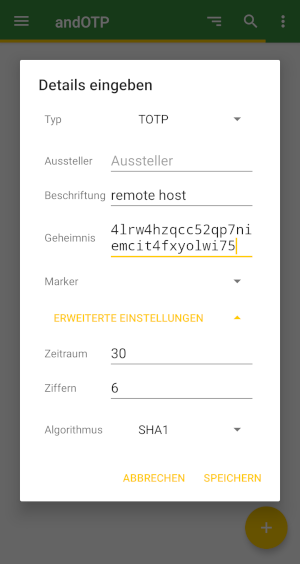

The possibility of reading the shared secret and settings for calculating a TOTP using a QR code will be covered in an upcoming article.
Conclusion
The examples presented demonstrate how easy it is to extend even existing services with two-factor authentication using TOTP. It is only necessary to configure the connection to PAM and the use of the pam_oath module in the corresponding service file.
The procedure shown is primarily suitable for individual systems with a few user accounts to be secured. More complex installations and other methods for one-time passwords are also possible.
Support
If you require support with the configuration or use of two-factor authentication, our Open Source Support Center is at your disposal – if desired, also 24 hours a day, 365 days a year.